|
|
|
|
Performance of crossbred calves on acid processed or copper and iodine supplemented high glucosinolate mustard meal incorporated diets Tripathi M.K.*, Agrawal I.S., Sharma S.D. Department of Animal Science GB Pant University of Agriculture and Technology Pantnagar 263 145, India *Reprint request: Division of Animal Nutrition. Central Sheep and Wool Research Institute, Avikanagar - 304501, India. Tel: +91-1437-28072: Fax; +91-1437-28163; E-mail mktripathi@cswri.raj.nic.in
Abstract The Performance of growing calves was assessed on hydrochloric acid (HCI) treated (16 ml HCI per kg meal raising the moisture content to nearly 40 percent, diffused for 72 hrs. followed by heating at 180°C for 2h, (T2), copper and iodine supplemented (500 mg each per kg meal as CuSO, and KI, respectively (T3) and untreated mustard (Brassica juncea) meal (T4) incorporated diets, completely replacing soybean meal of control diet (T1), in a 24 weeks growth trial, with 6 crossbred (Jersey × Sahiwal) calves in each treatment. The calves fed T2 diet gained more weight (P<0.05) as compared to those on T1 diet. The ADG was the highest in T2 (413g), followed by T3 (339g), T1 (3289) and T4 (1949). HCI treatment, copper and iodine supplementation improved DM intake and digestibility of nutrients. The DCP and ME intake per unit metabolic body size was similar (P>0.05) among soybean meal, HCI treated and copper and iodine supplemented groups, but was higher (P<0.05) as compared to untreated mustard meal diet. Body composition of calves in four groups was similar; the total body water, protein and fat content ranged, respectively, from 45.6 to 59.6, 12.6 to 16.8 and 18.6 to 35.8 per cent of the body weight. Mustard meal after HCI treatment can be utilized as suitable substitute for soybean meal in the diet of growing crossbred calves. Top Key words Mustard meal, Glucosinolate, Copper, Iodine, HCI treatment, Calves. Top | Introduction Mustard (Brassica juncea) meal, a residue left after oil extraction of seeds, is rich in crude protein and well balanced with amino acids. Glucosinolates, the antinutritional factor present in the meal, reduce palatability and restrict its incorporation in livestock feeds. The degradation of glucosinolates into toxic compounds i.e., thiocyanate, isothiocyanate and nitrites produced either by myrosinase enzyme inherently present in the cellular compartment of the feed or by the enzyme produced by bacterial microflora (Nugon-Baudon et al., 1990), suppress thyroid uptake of iodine and lower thyroid hormone levels (Barrett et al., 1997). The different cultivars of mustard grown in India contain glucosinolates varying from 12 to 90 mg per g meal (Chauhan et al., 1999). Out of various methods, acid treatment was found to reduce intact glucosinolates (Tripathi and Agrawal, 1998) upto 90% in mustard meal. Further more, feeding of rapeseed meal induce copper and iodine deficiencies in animals (Barry et al., 1981; Sharman et al., 1981). Supplemental iodine had an inhibitory effect of thiocyanate on iodine secretion by the mammary gland (Miller et al., 1969) and increased milk iodine content (Laarveld et al. 1981), while that of copper increased erythrocyte and leukocyte counts (Medvetskie, 1985) in cattle. Thus, an attempt was made to study the performance of cross-bred calves fed diets containing Hydrochloric acid (HCI) treated, copper and iodine supplemented and untreated mustard meal completely replacing soybean meal. |
Top Materials and Methods Treatment of Mustard meal Expeller processed mustard meal, containing 89.8% dry matter (DM), 28.3% crude protein (CP), 10.7% ether extract (EE) and 46.2 mg glucosinolates per g of oil extracted meal, was treated with 16 ml HCI per kg. at 40 per cent moisture, diffused for 72 h and dried at 180°C in hot air oven for 1 hr as per method of (Tripathi and Agrawal, 1998). Animals and Housing Twenty four male cross-bred (Jersey × Sahiwal) calves (230 ± 15.40 days and 86.6±2.7 kg BW) were randomly assigned to four dietary treatment (T1, T2, T3 and T4) on the basis of age and body weights. The animals were housed in individual pens. Feeds and Feeding Four concentrate mixtures were fed to four groups of experimental calves. Concentrate mixture (CM-I) contained soybean meal (SBM) and served as control, while CM II,III and IV contained mustard meal, HCI treated, untreated mustard meal and supplemented with CuSO4 and KI, each @ 500 mg per kg and untreated mustard meal, respectively (Table 1). The respective concentrate mixtures were fed to meet the total protein requirement (ICAR, 1998) of calves and allowances were adjusted as per increment in the body weights throughout 24 weeks feeding. The Oats hay (Trial I) or a mixture of green (Trial II) Jowar (Andropogon Sorghum), Maize (Zea mays) and Oats (Avena sativa) in equal proportions was fed as basal roughage ad libitum to meet rest of the energy requirements. Free choice of water was available to the animals twice a day in the morning and evening. The animals were dewormed in the beginning of the experiment with albendazole @ 10 mg/kg body weight. The calves were weighed for three consecutive days at each fortnight before offering feed and water, the mean of which was used to assess the total and average daily gain.
Digestibility trials Two digestibility trials each of seven days duration, at 45 days and 175 days of experimental feeding were carried out in individual pens by conventional total collection method. During the trial samples of concentrate mixture, feed offered, orts and faeces were collected. The mean of initial and final body weight during trial were used for the calculation of intake. Samples of feed, faeces and orts were dried in hot air oven, pooled and ground samples were utlilized for chemical analysis. A part of preserved fresh faeces was used for nitrogen estimation. Chemical analysis Samples of feed, orts and faeces were analysed for proximate principles (AOAC, 1990) and cell wall fractions (Goering and Van Soest, 1970). The gross energy (GE) content was determined by chromic oxide indicator method (Hill et al., 1960). The metabolizable energy (ME) of ruminant feeds was calculated using the following equation (Kirchgessner, 1995):
where, ME = ME of feed (MJ/kg), DXL = Digestible total lipids (g/kg), DXF = Digestible total fibre (g/kg), DOM = Digestible organic matter (g/kg), XP=N {6.25 (g/kg)} Total glucosinolate content of mustard meal and concentrate mixtures was determined using thymol method (Tholen et al., 1989). Calcium was estimated by titrimetric method (AOAC, 1965) and phosphorus by colorimetric method (Donald et al., 1956). Copper and iron levels in feeds were determined using atomic absorption spectrophotometer (Perkin-Elmer, USA). Body composition The body composition of experimental calves was determined at the end of growth trial using antipyrine dilution technique as suggested by Brodie et al. (1949) and modified by Wellington et al. (1956). The total body water was calculated (Soberman, 1950) from antipyrine level in plasma. The empty body weight was determined using the procedure of Bensadoum et al., (1963), whereas body fat and body protein by Reid et al. (1963). The body mineral content was determined by subtracting the water and organic matter content of the body. Statistical analysis Data of intake and digestibility were subjected to analysis of variance (Snedecor and Cochran, 1968). Data on growth were analysed using mathematical model (Harvey, 1975).
Where, u = General mean, Ti = Effect of ith treatment, Aj = Effect of jth age, Wk = Effect ofkth initial body weight, eijk= Random error. Top Results and Discussion The HCI treatment substantially reduced glucosinolate content of mustard meal (4.5 mg/g) as compared to 46.2 mg in raw meal. The glucosinolate content of CM II, CM III and CM IV was 2.2, 25.0 and 25.5 mg/g meal, respectively. The HCI treatment destroyed glucosinolate (Tripathi and Agrawal, 1998), so, it was lower in CM II. |
Nutrient digestibility The digestibility of nutrients was similar (P>0.05) in all the four groups in trial I, whereas, it was significantly (P>0.05) different in trial II (Table 2). The digestibility of OM, CP and GE was similar in T1, T2 and T3 and was higher to that of T4, whereas the digestibility of DM was highest in T2 as compared to that on other diets, which was similar (P>0.05). However, the NDF digestibility was depressed on T4 diet than the comparable digestibility on other diets. But ADFwas digested similarly by calves on all diets. The glucosinolate present in the mustard meal exhibited deleterious effects on the digestive abilities of the calves and the lower digestibility coefficients were in T4 during trial II. Further, it is envisaged that glucosinolates require some time for the manifestation of their deleterious effects on animal performance. Hence, the digestibility of the nutrients on untreated mustard meal affected adversely. These are in agreement with the results of Tripathi et al. (1995). The digestive processes as a result of microbial and fungal activities in the rumen got disturbed due to antifungal properties of glucosinolates (Manici et al., 1997; Verkerk et al, 1997) But HCI treatment, copper and iodine supplementation were found to reduce such deleterious effects and thereby, improved nutrient digestibility.
Plane of nutrition, growth and body composition The daily intake of concentrate mixture was similar among the calves on all the diets during both the trials. However, the DMI per 100 kg body weight (P<0.01) and per unit metabolic body size was higher (P<0.05) on control diet than the comparable intake on test diets during trial I and it was due to variation in DMI through roughage (Table 3). The DCP and ME intake per unit metabolic body size were lower (P<0.05) on untreated mustard meal incorporated diets, but the intake of these constituents were similar on all other diets. The intake of DCP and ME was as per requirements of ICAR (1998) on all the diets, except on T4, which was lower by 27 and 24 per cent for DCP and ME, respectively.
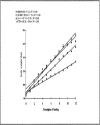
The growth of calves on untreated mustard meal was depressed as compared to similar growth of calves on other diets. The average ADG was 328, 413, 339 and 1949 in TI, T2, T3 and T4 groups, respectively. The growth of calves was constantly poor in T4 group inspite of an increase in feeding period (Fig 1). The body composition of calves was found to be similar among all the groups (Table 4). The poor growth response on untreated mustard meal (T4) was probably due to the cumulative effect of lower DCP and ME intake, and the presence of glucosinolate in the diet. The lower average daily gain was also reported (Kossaibatti and Bryant, 1994; Tripathi et al., 1998) on untreated rapeseed/mustard meal as compared to SBM or GNC diets. Glucosinolates and/or its metabolites impairs liver function, induce iodine deficiency (Panter and James, 1990; Barrett et al., 1997) and create hindrance in DNA synthesis (Nugon-Boudon and Rabot, 1994; Verkerk, 1997), thereby impaired growth. The HCI treatment (T2), Cu and I supplementation (T3) reduced such deleterious effect of glucosinolate and resulted in a better growth. Further, the supplementation of copper during active growth phase acts as a growth promoter and iodine supplementation normalises the availability of iodine for the thyroid. The heating during HCI treatment of meal not only decomposes the glucosinolate, it also reduces the degradability of protein and improve the efficiency of utilization of amino acids for growth (Mustafa et al., 1999).
Top CONCLUSION Incorporation of mustard meal as a protein source in the diet of growing calves though didn't affect intake and body composition, but the glucosinolates present in the feed exerts deleterious effect on digestibility and growth. The glucosinolate require some time for the manifestation of its deleterious effect on digestibility and growth. The HCI treatment as well as Cu and I supplementation mitigated the adverse effect of glucosinolates and improved nutrient digestibility and growth performance. The mustard meal after HCI treatment was found to be a suitable substitute of the SBM in the diets of growing calves. |
Top Figure | Figure 1: Body weight changes of calves on various dietary treatments
|  | |
|
Tables | Table 1: Ingredients (% air dry basis) and chemical composition (% in DM) of concentrate mixtures and roughage
| | Feed ingredients | Concentrate mixtures | Roughage |
|
| | CM I | CM II | CM III | CM IV | A | B |
| | Ingredients | | Soybean meal | 26.50 | − | − | − | | | | Mustard meal HCI treated | − | 49.50 | − | − | | | | Mustard meal UT | − | − | 49.50 | 49.50 | | | | Deoiled rice bran | 35.00 | 24.00 | 24.00 | 24.00 | | | | Wheat | 35.50 | 23.50 | 23.50 | 23.50 | | | | Salt | 1.0 | 1.0 | 1.0 | 1.0 | | | | Mineral mixture* | 2.00 | 2.00 | 2.00 | 2.00 | | | | Chemical composition | | CP | 22.25 | 22.31 | 22.33 | 20.13 | 14.75 | 7.88 | | OM | 90.02 | 89.02 | 88.60 | 89.12 | 88.35 | 86.92 | | EE | 1.50 | 1.50 | 1.38 | 1.00 | 1.60 | 1.50 | | NDF | 45.6 | 42.6 | 43.0 | 48.0 | 60.95 | 72.5 | | ADF | 16.4 | 17.7 | 17.4 | 16.5 | 38.85 | 49.6 | | ADL | 2.4 | 3.6 | 2.7 | 2.9 | 5.70 | 7.3 | | AlS | 2.15 | 2.63 | 2.60 | 2.38 | 4.98 | 8.55 | | Calcium | 2.40 | 2.35 | 2.50 | 2.40 | 1.65 | 1.70 | | Phosphorous | 0.90 | 0.91 | 0.92 | 0.98 | 0.16 | 0.19 | | Copper (ppm) | 49.4 | 114.3 | 240.5 | 112.0 | ND | 100.7 | | Iron (ppm) | 795.0 | 934.0 | 700.0 | 742.0 | ND | 3374.0 | | Glucosinolate (mg/g) | 0.0 | 2.2 | 25.0 | 25.5 | ND | ND |
| *Contained: (g/kg) calcium 320, phosphorus 62, manganese 2.7, zinc 2.6 and (ppm) iron 1000, fluorine 900, iodine 100, copper 100. | | AOats hay (Trial I); B Mixture of green jowar, maize and oats in equal proportions (Trial 11). | | UT; untreated; ND. Not determined. |
| | | Table 2: Nutrient digestibility in calves during metabolism trial
| | Attributes | Treatments | SEM |
| | T1 | T2 | T3 | T4 |
| | Trial I | | DM | 63.14 | 61.80 | 63.23 | 62.48 | 1.61 | | OM | 65.11 | 63.75 | 65.04 | 64.36 | 1.16 | | CP | 65.32 | 66.91 | 67.65 | 67.61 | 1.34 | | NDF | 61.25 | 58.61 | 59.30 | 57.79 | 1.36 | | ADF | 50.66 | 45.61 | 51.03 | 49.79 | 2.01 | | GE | 63.47 | 62.14 | 63.72 | 62.34 | 1.62 | | Trial II | | DM* | 56.8b | 60.9a | 56.8b | 49.7b | 2.47 | | OM* | 59.9a | 61.5a | 59.6a | 52.5b | 1.80 | | CP* | 60.0a | 62.2a | 63.3a | 47.5b | 3.87 | | NDF* | 57.9ac | 59.5ac | 56.1bc | 49.7b | 2.32 | | ADF | 43.9 | 46.2 | 40.7 | 34.6 | 2.98 | | GE* | 56.2a | 57.8a | 56.0a | 48.5b | 2.26 |
| abcMeans with different superscripts in a row differ significantly | *Means with different superscripts in a row differ significantly: P<0.05 |
| | | Table 3: Effect of treatments on plane of nutrition in calves
| | Attributes | Treatments | SEM |
| | T1 | T2 | T3 | T4 |
| | Dry matter intake (DMI) | | Trial I | | Roughage* | 3.60a | 3.1bb | 2.86b | 2.96b | 0.33 | | Concentrate | 1.19 | 1.18 | 1.18 | 1.17 | 0.04 | | DMI (kgll00 kg BW)** | 4.06a | 3.93b | 3.67b | 3.88b | 0.09 | | DMI (g/kg w0.75)* | 133.6a | 127.7b | 121.3b | 122.4b | 4.86 | | Trial II | | Roughage | 3.66 | 3.95 | 3.41 | 2.92 | 0.33 | | Concentrate | 1.22 | 1.41 | 1.24 | 1.11 | 0.91 | | DMI (kg/100 kg BW) | 3.39 | 3.41 | 3.39 | 3.18 | 0.11 | | DMI (g/kg W0.75 | 116.1 | 120.4 | 115.7 | 105.4 | 0.51 | | Digestible crude protein intake | | g/day* | 354.32a | 368.96a | 326.99a | 220.46b | 34.79 | | g/kg W0.75* | 8.48a | 8.28a | 8.08a | 5.38b | 0.62 | | Consumed % of requirement | 118 | 115 | 108 | 73 | − | | Metabolizable energy intake | | Mcal/day* | 9.39a | 10.39a | 8.79ab | 7.16b | 0.82 | | Mcal/kg W0.75* | 0.226a | 0.234a | 0.218ba | 0.192b | 0.01 | | Consumed % of requirement | 100.00 | 103.00 | 97.67 | 86.27 | − |
| abMeans with different'superscripts in a row differ significantly | *: P<0.05 | **: P<0.01 |
| | | Table 4: Average daily gain and body composition (% of live weight)
| | Attributes | Treatments | SEM |
| | T1 | T2 | T3 | T4 |
| | Average daily gain | | ADG (g/day)* | 328a | 413a | 339a | 194b | 41.5 | | Body composition | | Empty body weight | 123.1 | 139.9 | 123.8 | 106.1 | 10.47 | | Water | 55.4 | 45.6 | 53.2 | 59.6 | 3.35 | | Protein | 15.7 | 12.8 | 15.0 | 16.8 | 0.98 | | Fat | 22.6 | 35.8 | 26.0 | 18.6 | 12.62 | | Mineral matter | 6.1 | 58.0 | 5.9 | 5.0 | 1.48 |
| aMeans with different superscripts in a row differ significantly | bMeans with different superscripts in a row differ significantly | *:P<0.05 |
| |
| Acknowledgements The authors wish to thank Dr. Mahender S Rahal, Associate professor, Animal Nutrition, G.B. Pant University of Agriculture & Technology, Pantnagar for his critical suggestions, valuable help and cooperation during the experiment. Top References | | AOAC
1990.
Official Methods of Analysis.
15th ed.Association of Official Analytical Chemists,
Washington, DC TopBack | | AOAC
1965.
Official Methods of Analysis.
10th ed.Association of Official Analytical ChemistsWashington, DC TopBack | | BarrettJ.E., KlopfensteinC.F., LeipoldH.W.
1997.
Detoxification of rapeseed meal by extrusion with an added basic salt.
Cereal Chemistry,
74:
168–170. TopBack | | BarryT.N., McDonaldR.C., ReidT.C.
1981.
Nutritional evaluation of Kale (Brassica oleracia) diets. 1. Growth of grazing lambs as affected by time introudction to the crop, feed allowance and intraperitoneal amino acid supplementation.
Journal of Agricultural Science, Cambridge,
96:
257–267. TopBack | | BensadoumA., Van NiekerkB.D.H., PaladinesD.L., ReidJ.T.
1963.
Evaluation of antipyrine, N-acetyl-4-amino antipyrine and shrunk body weight in predicting the chemical composition of sheep body.
Journal of Animal Science,
22:
604–612. TopBack | | BrodieB.B., AxelrodJ., SobermanR., LevyB.B.
1949.
The estimation of antipyrine in biological materials.
Journal of Biological Chemistry,
179:
25–29. TopBack | | ChauhanJ.S., JhaS.K., YadavS.K., KumarP.R., ShuklaA.K., SinghY.P.
1999.
Quality rapeseed-mustard varieties in India. A perspective.
Technical Bulletin No.-9.
National Research Centre on Rapeseed-mustard,
Sewar, Bharatpur, Rajasthan. TopBack | | DonaldR., SchwehrE.W., WilsonH.N.
1956.
Colorimetric method for estimation of phosphorus in feeds, fodders and faeces.
Journal of the Science of Food and Agriculture,
7:
677–682. TopBack | | GeoringH.K., Van SoestP.J.
1970.
Forage fibre analysis (Apparatus, Reagents, Procedures and Some Applications),
Handbook No. 19379.
ARS USDA,
Washington. DC. TopBack | | HarveyW.R.
1975.
Least Square Analysis.
United States Department of Agricultural Research Services (ARS)Washington, DC. TopBack | | HillF.W., AndersonD.L., RennerR.R., CarewL.B.Jr.
1960.
Studies on the metabolizable energy of grain and grain products for chickens.
Poultry Science,
39:
573–597. TopBack | | ICAR
1998.
Nutrient Requirement of Livestock and Poultry,
Indian Council of Agricultural ResearchNew Delhi. TopBack | | KirchgessnerM.
1995.
Energy evaluation in ruminants.
Proceedings of the Society of Nutrition, Physiology,
4:
121–123. TopBack | | KossaibattiM.A., BryantM.J.
1994.
Effect of rapeseed-meal and fish-meal supplementation of maize silage-based diets upon the tissue growth and body composition of store lambs.
Animal Production,
58:
57–63. TopBack | | LaarveldB., BrockmanR.P., ChristensenD.A.
1981.
The effects of tower and midas rapeseed meals on milk production and concentration of goitrogens and iodide in milk.
Canadian Journal of Animal Science,
61:
131–139. TopBack | | ManiciL.M., Lazzeri, Land PalmieriS.
1997.
In vitro fungitoxic activity of some glucosinolates and their enzyme derived products towards plant pathogenic fungi.
Journal of Agriculture and Food Chemistry,
45:
2768–2773. TopBack | | MedvetskieM.S.
1985.
Some morphological and biochemical indications in blood of young cattle given hacedemants.
Biologicheskie Aktivnye Zhivotriykh,
45:
26–2. TopBack | | MillerJ.K., MossB.R., SwansonE.W.
1969.
Effects of 131 thyroid irradiation damage, thyroxin and thiocyanate on radioiodine metabolism in dairy cows.
Journal of Dairy Science,
52:
677–783. TopBack | | MustafaA.F., McKinnonJ.J., ChristensenD.A.
1999.
Effect of moist heat treatment on in vitro degradability and ruminal escape protein amino acids of mustard meal.
Animal Feed Science and Technology,
76:
265–274. TopBack | | Nugon-BaudonL., RabotS.
1994.
Glucosinolates and glucosinolates derivatives: Implications for protection against chemical carcinogenesis.
Nutrition Research Reviews,
7:
205–231. TopBack | | Nugon-BaudonL., RabotS., WalJ.M., SzylitO.
1990.
Interactions of the intestinal microflora with glucosinolates in rapeseed meal toxicity: first evidence of an intestinal lactobacillus processing a myrosinase like activity in vivo,
Journal of the Science of Food and Agriculture,
52:
547–559. TopBack | | PanterK.E., JamesL.F.
1990.
Natural plant toxicants in milk.
Journal of Animal Science,
68:
892–904. TopBack | | ReidJ.T., BensadoumA., PaladinesD.L., Van NiekerkB.D.H.
1963.
Body water estimation in relation to body composition and indirect calorimetry in ruminants.
Annals of New York Academy of Science.
110:
327–336. TopBack | | SharmanG.A.M., LowrsonW.J., WhitelawA.
1981.
Potential growth limiting factors in the Brassica.
Animal Production,
32:
383–389. TopBack | | SnedecorG.W., CochranW.G.
1968.
Statistical Methods.
6th ed.The Iowa State University Press,
Ames, Iowa. TopBack | | SobermanR.J.
1950.
Use of antipyrine in measurement of total body water in animals.
Proceedings of the Society of Experimental Biology and Medicine,
74:
789–792. TopBack | | TholenJ.T., ShifengS., TruscottR.J.W.
1989.
The thymol method for glucosinolate determination.
Journal of the Science Food and Agriculture,
49:
157–165. TopBack | | TripathiM.K., TyagiA.K., KarimS.A.
1995.
Effect of mustard cake and its glucosinolate on milk production, milk composition and blood biochemistly of lactating ewes.
World Review of Animal Production,
31:
32–34. TopBack | | TripathiM.K., AgrawalI.S.
1998.
Effect of HCI treatment with heat on glucosinolates content of rapeseed-mustard meal.
International Conference on Sustainable Animal Production,
Health and Environment. HAU,
Hisar, India. TopBack | | TripathiM.K., MondalD., KarimS.A.
1998.
Effect of high glucosinolate diet on growth, carcass quality and haematology of Avivastra lamb.
Proceedings of 8th World Conference on Animal Production.
Seoul,
Korea, p.
928–929. TopBack | | VerkerkR., GaagV.D., DekkerM., JongenW.M.F.
1997.
Effect of processing condition on glucosinolates in cruciferous vegetables.
Cancer Letters,
114:
193–194. TopBack | | WellingtonG.H., ReidJ.T., BratzierL.J., MillerJ.
1956.
Use of antipyrine in nutritional and meat studies with cattle.
Journal of Animal Science,
15:
76–85. TopBack |
| |
|
|
|