|
|
|
|
Data logging, graphical process visualization of cryogenic plant parameters through PLC Srinivasan K V1 1Low Temperature Facility, Tata Institute of Fundamental Research, Mumbai-400 005. India. Abstract The objective is to monitor the operation of cryogenic plants effectively, as the available skilled manpower is much limited and also the operation being at very low temperatures and also from safety point of view (due to involvement of high pressure). Even though, the current helium liquefiers are fully automated, still there are large numbers of plant operative parameters, arising from auxiliary equipments which needs to be monitored and controlled for the smooth & trouble free plant operation. Further, the important task in the cryogenic facility is to keep a watch on the plant healthiness, advance indication about the possibility of problem progressiveness by means of pre-warning or alarms, so that the remedial action can be taken well before the actual failure affects the plant operation, so that the plant down time is kept almost negligible. Our paper will describe our work carried out at TIFR, Mumbai. Top | Introduction Operating cryogenic plants such as liquid nitrogen generator, helium liquéfier is a challenging job and much more demanding is to operate it efficiently. We at TIFR proposed a method, which is modern, simple, easy to use, but powerful tool for a trouble free, with minimal plant down time operation, particularly with the restricted work force availability. The primary objective is to keep a close watch on the plant, so that the possible failures, which can stop the plant operation, can be diagnosed much before it reaches the plant. However, our efforts are towards the development of model cryogenic facility, with full-fledged automated & paperless facility. We used the programmable logic controller (PLC) devices and various field signal modules to read the process signals such as pressure, temperature, purity, volume etc. With the help of the suitable software program, the process is graphically monitored and controlled on a real time basis. |
Top Parameters to monitor The typical parameters measured in cryogenic plants are mostly pressure, helium gas purity, moisture content, utility pressure, utility temperature, gas balloon level, mass flow, oxygen content etc. These parameters can be monitored at various locations in the cryogenic facility, such as helium gas recovery line, helium gas recovery compressor, impure helium gas storage, pure helium gas storage, helium buffer vessel, utilities like chilled water and instrument air. The location and the parameters to be monitored are chosen in such a way that the data is useful in diagnosing the plant problem and scope for rectifying the problem well before it affects the plant operation. |
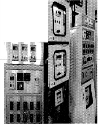
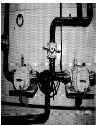
Top Hardware Choosing appropriate hardware such as transducers, monitors and analyzers for monitoring the process plays an important role in the automation. The transmitters to be within the usable range, rugged, durable, easily available, interchangeability and characterized by a linear output signal, fast response and be cost effective. Transmitters and analyzers used for measuring the process signals are chosen such that the output is an analog signal with mostly with 4-20mA current loops. We have used a variety of transmitters from a wide choice of availability from indigenous to import one. Most of these transmitters are connected with the indicators, which are fitted in the control panel for easy access and as a backup module in case of unforeseen software bugs. The details of the analyzer used in this project are listed as Table 1. |
A photo of some of the instruments and its indicator panel is attached in Figure 1. |
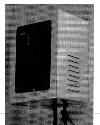
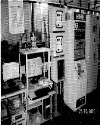
Top About the PLC The following paragraph provided the details about the PLC and its related modules used in LTF. For hooking the field signal received from the transmitters, the Siemens make, S7–400 PLC system has been used. The processing speed of this PLC is very high and the field values are updated every 150 milli-seconds, which is almost like a real time monitoring. This SIEMENS-PLC system comprises of CPU 412.2 with flash FEPRAM 256KB, and the signal modules viz., analog input cards 16 Ch-12 Bit, analog output card 8Ch-13 Bit, digital input card 32Ch-24VDC, digital input card 16Ch-120/20 VAC, digital output card 32Ch-24VDC, digital output card 16Ch-120/230VAC. All these modules are fitted in the rack of nine slots. For the regulated power supply, to the above PLC, a Siemens make, power supply PS407 with 120/230 VAC, 5VDC, 24VDC, 10 Amps is used. For the transfer of data from the PLC to the remote PC, the MPI/PCI Adapter card CP 5613, profiBUS cable and the profi-BUS adapter has been used. Photo of the above mentioned Siemens make S7–400 PLC system at LTF is shown in Figure2 |
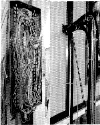
Top Interconnection Field signals (analog) from all the above transmitters are wired to the PLC signal modules, with the help of multi core shielded cable. For the operational convenience, we used the 50 core shielded cable of 2.5 mm2size. For the purpose of identification and ease in maintenance, the field cables from the transmitters are terminated at the junction box near the PLC unit, with the identification tags. The connection from the junction box to the PLC is by the multi-core shielded cable. Photos showing the PLC cabling and the junction box are shown as Figure 3. |
Top Software In order to read the analog signal received from the field, a suitable program is written and stored in the CPU of PLC. The statement list (STL) format is used for this purpose. The communications to the Siemens make, S7–400 PLC and the computer is through the software. Siemens uses Symantec Step 7 software for programming and WinCC software for graphical visualization. Basic initialization like hardware designation, channel addressing, tag name, organizational block, data blocks were programmed.. |
Top Monitoring and control it was’ necessary to view all the data in a suitable format so that the entire process is simple and easily understandable. A draft AutoCAD drawing was made for this purpose, before making the actual visualization. Using WinCC visualization software, the status of the parameters are monitored and displayed in the form of graphical visualization in a remote PC. The connection from the PLC to the remote PC is made with a help of Siemens make, CP5613 card via the profi-BUS cable. During the startup phase, we have used the above software only for the purpose of monitoring. Later, we added many alarms, trip values supported with the auto logging of tags. |
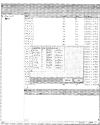
Top Graphical Visualization Based on the above AutoCAD drawing, a graphical window was created in WinCC software with the concerned tags of the field signals received from the transducers is displayed at appropriate locations in the graphical window. The screen shot of the recent version of the graphical window for the Helium gas management is pasted in Figure 4. |
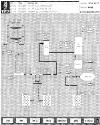
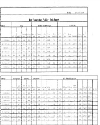
Top Data logging and reporting Report generation is essential for analyzing the data, particularly in case of any abnormality of a parameter. To investigate the abnormality and its influence on the other plant parameters, these reports will help us in nailing down the problem precisely. Considering this critical need, we have made a provision in the software, for automatic data logging in an interval of every 10 minutes. All the hooked parameters are stored in an excel format, which is easy & simple for data retrieval and analyzing. In addition to the auto logging, the software is programmed in such a way that the hooked parameters are printed every hour with the help of an online printer, so that the shift wise online report generation is made for a period of every eight hours. These reports are automatically printed at 7AM, 3PM and 11PM on a continuous basis. The copy of the sample shift report is reproduced below as Figure 5. |
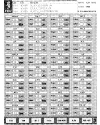
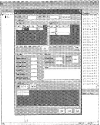
Top Alarms & control In order to trigger an alarm, it is necessary to define the set limits of the parameters both high and low alarm. In order to define the high and low alarm of all the parameters of the Helium gas management PLC, a separate screen was developed. Enough care was taken, so that the alarm set limits are enabled or disabled with a simple operation. Provisions to set the high and low alarms of individual parameters were assigned along the key to enable/disable the alarm. The screen shot of the above alarm setting is given as Figure 6. The developed software has provision to track the triggered alarms for data retrieval and for the process diagnostics purpose. |
Top Alarm messages through SMS & Email To cope with the modern tools and to bring the plant operation close to the operating staff, we thought that the plant information's need to be passed on to operating staff on an online basis. This could be possible if the status information and the other critical parameters are sent by SMS via mobile phone and also through email. Recently, we have identified more than 30 critical parameters and the status information of the helium liquefier and the gas management PLC, which is to be connected to the email and SMS. We have already activated the email service and the testing with SMS is currently being tried out. We are proposed to use the SIM card enabled modem with USB end port for this SMS. The details about the status information of the helium gas management sent by Email and SMS are shown in Figure 7. |
Top E-Logging With the above automation and the report generation, our operating staff had stopped using the traditional logbook for the past two years, However, there are few parameters like the equipment hour meter, helium gas flow integrator reading, inter communicating note of operator in shift duties, any visual abnormality in the facility, number of cylinders/quads in use, safety related information's are usually recorded in the logbook or duty report. |
We decided to automate even the above part of the operation, by introducing the E-Logbook facility. The work towards this E-Logbook is in the final shape and the sample screen of the same is reproduced in Figure 8. |
Top Online Helium gas accounting The helium gas recovered from all the laboratories, user end, cryostat, Dewar's etc are recovered back, for reuse in all cryogenic facilities, as we know that helium gas very expensive. |
In order to keep a close watch on the helium gas accounting, we are currently in the process of developing the online helium gas accounting. For this purpose, the helium gas meters are equipped with the digital pulse counter, so that the PLC can utilize the digital pulse for calculating the quantity of gas received in a given point of time. With the accumulated gas volume of the balloon and the pressure rise in the storage gas cylinder, the gas is accounted for loss/gain. The details are checked every 10 minutes and the online loss/gain report is generated with alarm for any abnormal helium gas loss. |
The helium gas flow meter is already installed and we are currently in the final stage of connecting the digital pulse to the PLC. The photo of the installed gas flow meter is given in Figure 9. |
Top Development of add-on automation to the L280 Helium Liquefier Considering the advantages of the above report generation, alarm triggering, Email and SMS, we felt that the similar facility be extended to the have extended to the Helium Liquefier (Model: L280 of M/s Linde |
Kryotechnik, Switzerland). Since, the above liquefier already using the Siemens PLC and WinCC visualization for remote monitoring and diagnostics, utilization of triggered alarm by Email and SMS become much easier. All the plant (more than 40) parameters, including the process status information of the helium liquefier have been added to the online report generation for every 8 hours in addition to the every 10 minutes data logging, which was developed by us. |
Top Automation in Cryogens dispensation In order to ensure the complete automation of the cryogenic facility, the dispensation process of the cryogens (both liquid nitrogen and liquid helium) are also automated. New computer software has been developed in such a way that it is self-supportive and the users can directly interact with the system, without any assistance by LTF staff. For the sake of accounting and authenticated operation, access to this software is password protected. The filling and dispensation of liquid helium is made on the basis of weight for the sake on operational convenience. |
Top Status and Performance At present, the hooked parameters are being monitored along with all possible alarm triggering in case any parameters deviate from their allowed limits such as, recovery quad pressure exceeding 145 bar; moisture of line drier outlet gas shoots above 200ppm, impure helium gas regulated pressure exceeds 32bar. At present, no control loop is added in the program and is planned in future. The present format of data logging and report generation gives us sufficient room for analyzing the problems in a better way. By connecting the PC to the Internet and using the remote PC connectivity software such as Symantec PC Anywhere/Team viewer, it has become possible to view the plant parameters at any point of time and from anywhere in the world, thus the system is truly remote operated. All the operations are monitored from the control room and Figure: 10 show the view of the control panel with the visualization PC's are positioned at the plant control room. |
Top Future up gradation As a part of up gradation, it is proposed to have control and many more alarm triggering, possibilities of showing the valve status, hour meter readings, alarm for indication the forthcoming preventive maintenance, compressor running/stop indications, solenoid valve status and adjustment of control valves if any are being planned in the future. |
Top Summary With the suitable hardware and a PLC, it is possible to develop this auto logging system in a much simple way so that operation of the plant becomes much easier, comfortable and highly effective, even with the less available workforce. We have developed this method in such a way that, this can be extended to the any of the cryogenic facility. Thus, the results and the benefits of this concept are highly advantageous for the effective helium liquéfier operation. |
Top Acknowledgements The author thanks Mr. K A Jaison of LTF/TIFR for carrying out the installation of PLC, carrying out the signal cabling of various transmitters and helping me in various other aspects of this automation works. The author also thanks Mr. Vijay Arolkar of LTF/TIFR for helping in the connection of all the transducers, analyzers, meters to the panel and its process gas piping. The author also records his thanks to Prof. Paulose, Prof. S K Dhar and other colleagues of TIFR for their constant support and technical guidance. |
Top Figures | Fig 1:: Photo of the hardware fitted In the panel
|  | |
| | Figure 2:: PLC System at LTF
|  | |
| | Figure 3:: PLC cabling and the junction box
|  | |
| | Fig4:: Graphical window for L280 Gas management
|  | |
| | Figure 5:: Sample copy of the shift report
|  | |
| | Figure 6:: Screen shot of the Alarms enabling screen
|  | |
| | Fig 7:: Screen shot o f alarms picked for SMS & Email
|  | |
| | Figure 8:: Screen showing the E-logglng page
|  | |
| | Figure 9:: He gas flow meter with digital signal output
|  | |
| | Figure 10:: View of conimi panel with visualization
|  | |
|
Table | Table 1:: List of Process parameters
| | GAS BAG PRESSURE | | RECOVERY COMPR.DISCHARGE PR. | | LINE DRYER PRESSURE 1 | | IMPURE QUAD PRESSURE | | PURE REGULATED PRESSURE | | PURE QUAD PRESSURE | | E3LIFTER TANK PRESSURE | | CHILLED WATER INLET PRESSURE | | CHILLED WATER OUTLET PRESSURE | | INSTRUMENT AIR PRESSURE | | GAS BAG HELIUM PURITY | | GAS BAG 1 LEVEL | | GAS BAG 2 LEVEL | | LINE DRYER MOISTURE 1 | | LINE DRYER MASS FLOW | | LINE DRYER OXYGEN | | LINE DRYER MOISTURE 2 | | LINE DRYER HELIUM PURITY | | PURE GAS OXYGEN | | PURE GAS MOISTURE | | PURE GAS PURITY | | INSTRUMENT AIR MOISTURE | | UNIT AIR MOISTURE |
| |
| |
|
|
|