Low temperature magnetization and resistivity Studies on 3d-TM substituted at Mn site Bi-Manganite Vijayan D.1, Kurian Joji1, Singh R.1 1School of Physics, University of Hyderabad, Central University P.O., Hyderabad, 500046, India Abstract Manganites are known to be potential candidates in various applications like magnetic refrigeration, sensors, memory storage devices etc. Low temperature studies on these materials provide information about various transitions that the materials undergo caused by the evolution of different magnetic correlations. In this paper the effects of doping 3d-transition elements (TM) (V, Cu and Zn) at the Mn site of Bi0.5Ca0.5Mn0.95M0.05O3, on the ordered states of the material are presented. The data provides the value of Charge Ordering temperature, TCO, and the long range antiferromagnetic (AFM) ordering temperature, TN. Cu and Zn substitution decreases the TCO and melts AFM transition. Whereas, the TCO and TN values remain unchanged in the case of V- substituted sample. Below T ≈ 40 K the temperature independent magnetization is attributed to the freezing of FM inhomogeneities. The temperature dependent resistivity is analyzed using the Mott's and Efros-Shklovskii (ES) variable range hopping (VRH) models. Mott's VRH model is found to provide reasonable values of the model parameters. The data is also analyzed in view of the phase separation (PS) model. Top Keywords Manganties, Transition elements, Magnetization, Resistivity, Phase Separation Topic Code: 502. Top |
INTRODUCTION Manganese oxides with perovskite structure have been the subject of vivid interest in recent years because of their unusually electronic and magnetic properties [1],—Ferromagnetism—(FM)—and—charge-ordering (CO) are two mutually exclusive phenomena in manganites of the type R1-xAxMnO3 (R= La3+, Pr3+, Bi3+ and etc. and A= Ca2+, Ba2+ and Sr2+) [2]. In these compounds, the complex interplay between charge, spin, orbital and lattice degrees of freedom leads to a rich variety of novel physical properties such as intrinsic phase separation and CO [3,4,5], CO is usually regarded as a spatially ordered distribution of Mn3+/Mn4+ ions in the lattice. Bi(1.X)CaxMn03 exhibits a charge ordering (CO) transition, TCO, near room temperature (R.T.) over a wide range of × values [6]. Low temperature studies on the materials have provided information of different transitions that the materials undergo caused by the evolution of different magnetic correlations6. The CO state of Bi-manganites is robust 7, These properties have been attributed to additional lattice distortion produced by the highly polarizable 6s2 lone pair of Bi3+. The Mn (B) site modification directly affects the Mn3+-O-Mn4+ network by changing the Mn3+/Mn4+ ratio and electron carrier density, so physical properties of manganese perovskites are sensitive to dopants at the Mn (B) site [8]. In this paper the effects of doping 3d-transition elements (TM) (V, Cu and Zn) at the Mn site of Bi0.5Ca0.5Mn0.95I M0.05O3, on the ordered states of the material are presented. Our magnetization data indicate that the CO can be suppressed partially with no clear evidence of Neel temperature (TN) by Cu and Zn doping whereas the V doping shows the clear evidence of CO and Neel Temperature (Tn). The temperature dependent resistivity of the samples show semiconducting behaviour with the resistivity values varying from ≈ 1–10Ω cm at room temperature to ≈ 107Ω cm at the lowest recorded temperatures. |
Top EXPERIMENT The samples of Bi0.5Ca0.5Mn0.95TM0.05O3 with TM = Cu, V, and Zn were prepared using the conventional solid-state reaction method. Stochiometric mixtures of Bi2O3, CaCO3, MnO2 and oxides of 3d transition elements were mixed and ground. The samples were sintered in air at temperatures of 600–900°C for several hours with intermediate grinding. An extra amount of Bi2O3 was added to compensate for its loss during calcination. Pellets of the samples were made and sintered at 900°C for 6 hours. The XRD studies were carried out on all the samples to check the single phase formation. The temperature dependent magnetization studies on the samples were performed using a Quantum Design Physical Properties Measurement System (PPMS) in the temperature range of 4 — 350 K with applied field of 50 Oe. The rectangular shape pellets were used for resistivity measurements. The-Temperature—dependent—resistance—of the samples was measured by the four-probe method using a closed cycle refrigerator (CCR) fitted with a Lakeshore 330 temperature controller. |
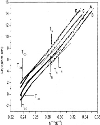
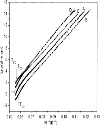
Top RESULTS AND DISCUSSION Magnetic Measurements Figure 1 shows the M v T plots of various synthesized samples. The peak in M(T) plots at around 300 K and 100 K corresponds to CO and AFM transitions, denoted as TCO and TN respectively. TCO value for undoped sample is 305K. The TCO values of 310, 304 and 294 K are obtained for Cu, V and Zn doped samples respectively. The AFM transition temperature, TN is not strongly dependent on dopant type. These values are ∼ 105K for the undoped as well as for doped samples. The magnetic moment slightly increases with Cu and Zn and it slightly decreases with the V substitution at Mn site. The cation disorder created by doping at the Mn site cannot account for the observed effects, since the disorder would not vary from one cation to another. In the case of 3d doped La-manganites it has been suggested that the doping elements participate directly to the band structure. These results can be explained in view of the valence state of the dopant ion. Copper can exist in the 1+, 2+ and 3+ states in manganites, though it is known to predominantly exist in the 2+ state in various La-manganites [9]. In the present series the increase in magnetic moment indicates the existence of Cu in the 2+ state, which strengthens the FM Double Exchange (DE) interaction between Mn3+ and Mn4+. The TCO value, though, is same as that of the undoped sample, maybe due to Cu2+ ions substituting Mn3+ ions. Zinc has a 2+ valence state and is a non magnetic ion [10]. Doping Zn2+ at the Mn site is expected to decrease the magnetization. But in the present case the increase in magnetic moment and the melting of CO and AFM ordering suggests the increase in the FM correlations due to the Zn doping. This could be related to the lower structural distortion and a richer Mn3+/Mn4+ ratio with the introduction of the dopant. This, on the other hand, will be interrelated to the oxygen stoichiometry. In other words, Zn2+ doping may alter the oxygen stoichiometry, which may alter the Mn37Mn4+ ratio adequately to enhance the FM correlations. Unlike the other dopants, Vanadium-doping lowers magnetic moment and retains the CO and AFM ordering. This can be due to existence of V in the 5+ valence non magnetic state (3d°4s°, S = 0) in the sample [11,12], The introduced V5+ ions substitute Mn4+ ions, inducing an extra Mn3+ JT ion. The V5+ introduces an extra Mn3+06 distortion apart from the one due to the JT effect. This in turn results in the carriers to be more localized, leading to decrease in the strength of the FM DE correlations between the Mn3+ and Mn4+ions and consequently the magnetization value. Figure 2 shows the M v T plots of the Cu, V and Zn doped samples below ∼ 70K. All samples, except the Zn doped sample, show a weak FM ordering below ∼40 K. The M values in FM ordered state are ≤ 50 memu/g for all samples. The magnetization data of the 3d-TM ion doped Bi0.5Ca0.5Mn0.95TM0.05O3 can be analysed qualitatively in view of the phase separation model [13,14,15]. The magnetic signals of these samples are due to the contributions of different combinations of the Mn3+, Mn4+ and the dopant ion used. For T > TCo the M values increase owing to the contributions of FM correlations which grow with decreasing temperature. At temperature just below TCo the sign of the slope changes (in varying degrees), indicating dominant contributions of AFM correlations, which gives rise to the CO state itself. On decreasing the temperature the sign of the slope changes again indicating dominant FM correlations. This is due to the competition between evolving FM and AFM phases with decreasing temperature. Below TN, for the undoped and V-doped samples, the sign of the slope changes, whereas for the other samples the slope decreases due to the enhanced contributions of the AFM clusters. At T ∼ 40 K M(T) increases and saturates at lower temperatures. The resistivity studies of the samples show them to be insulators down to the lowest temperatures. The weak FM ordering is therefore not related to long range FM ordering. This could possibly be due to the formation of localized inhomogeneities with weak FM correlations, spin canting and the suppression of the spin structure due to the Mn substitution or due to the possible weak FM interactions of the dopant ion with one or both of Mn3+, Mn4+ ions. Resistivity Measurements Figure 3 shows the resistivity (p) v temperature (T) plots for the samples. All the samples show semiconducting behaviour with the resistivities varying from «1–10Q cm at room temperature to = 107Q cm at the lowest recorded temperatures. The lowest recorded temperatures for different samples are limited to * 60–80 K as the resistivity of the sample become very large at low temperatures. The temperature dependent resistivity data is analyzed using two approaches (i) the small polaron model (based on the thermal activation hopping of carriers) [15] (ii) the variable range hopping (VRH) model [16]. Figure 4, shows Tco and TN for the samples. A kink seen in the high temperature data is denoted as the TCo-Below Tco an increase in the resistivity of the samples is typical of the CO state, which enhances the resistivity of the samples due to the confinement of the carriers at specific lattices sites. The temperatures at which the slope of the plot change drastically are depicted as the TN. This is attributed to the long range AFM ordering that sets in at Tn. Substituting Cu and V at Mn site in BCMO system enhances the resistivity of the sample. Increase in p by Cu-substitution is due to destruction of the DE interaction network and the introduction of random Coulomb potential caused by the substitution of Cu2+ for Mn3+ [17]. The V-doped samples show increased resistivity as the JT inactive V5+ replaces the Mn4+ ions, introducing enhanced strength of the AFM correlations [11]. The temperature dependent electrical transport for various manganites, especially in the semiconducting PM phase, have been explained using the VRH model [12]. The Motts variable range hopping (VRH) model is represented by the equation where N(EF) is the density of states at the Fermi level, which is assumed to be constant near the Fermi level. The value T0 is associated to the extension/localization length ∼1/a. The average hopping distance and hopping energy can be deduced from the model using equations and respectively. From the plots of Inp vs T−1/4 (figure 4) the TCO is estimated from the deviation of the straight line fit in the high temperature region. Apart from the change in the slope, no other unusual behaviour is observed in the plots at Tn. The T0 values are estimated from the slope of these curves and are listed in the table 2. The values of localization length, hopping distance and hopping energy calculated using the value of the density of states N(Ef) ∼ 1018cm−3 eV∼1 are listed in table 3. The validity of the Mott's VRH model to explain the conduction mechanism for any system is primarily judged by two conditions: (i) the hopping distance should be several times the Mn-Mn distance (∼5A°) and (ii) the localization length should be greater than the Mn-Mn distance. The localization lengths vary between ∼ 5.3 and 8.7A0 irrespective of the temperature range, for all the samples. The hopping distance varies between ∼ 7 and 8nm. The two conditions are obeyed throughout the temperature range, with only a change of the values observed due to the change of the slope of the plot at TN. Hence the Mott's VRH model can explain the temperature dependent resistivity behavior of the Bi0.5Ca0.5Mn0.95TM0.05O3 system. The Efros and Shklovskii (ES-VRH) model predicts the temperature dependence of resistivity as Figure 5 shows the Inp vs T−1/2 plots for the samples. All the samples show a linear dependence of Inp v T−1/2 throughout the temperature range T < Tco, similar to that reported for the undoped BCMO system in our earlier study [12]. The T0 and p0 values obtained from a linear fit in the entire temperature range below TCO are given in table 4. The average localization length £ estimated using these T0 values is found to be less than the unit cell dimension and physically unacceptable. 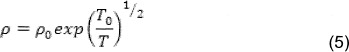 |
In summary, we studied the temperature dependent magnetic and resistivity behaviour of 3d-TM substituted at Mn site of Bi0.5Ca0.5Mn0.95TM0.05O3, where TM = Cu, V and Zn. The Cu and Zn doping enhance the FM correlations and lead to partial melting of CO state. The V doping enhances the AFM correlations and thus strengthens the CO state. The data is analyzed qualitatively in view of the phase separation (PS) model. The temperature dependent semiconducting behaviour of the resistivity is analyzed in view of the Mott's variable range hopping (VRH) model. Top Figures | Figure 1.: Magnetic moment (M) vs. temperature (T) plots for A-Undope Bi0.5Ca0.5Mn0.95TM0.05O3 (TM = B — V, C — Zn and D-Cu)
| 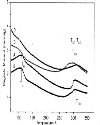 | |
| | Figure 2.: M vs T plots for A-Undoped and Bi0.5Ca0.5Mn0.95TM0.05O3 (TM = B — V, C — Zn, D-Cu) systems at the temperature region T< Tn.
| 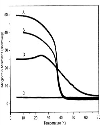 | |
| | Figure 3.: ρ vs T plots for A-undoped and Bi0.5Ca0.5Mn0.95TM0.05O3 (TM= B-Zn, C-V, D-Cu)
| 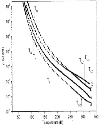 | |
| | Figure 4.: Lnp vs 1/T1/4 plots for A-undoped and Bi0.5Ca0.5Mn0.95TM0.05O3 (TM= B-Zn, CV, D-Cu)
|  | |
| | Figure 5.: Lnp vs 1/T1/2 plots for A-undoped and Bi0.5Ca0.5Mn0.95TM0.05O3 (TM= B-Zn, CV, D-Cu)
|  | |
|
Tables Table.1:
| | Dopant | Atomic Number | Ioni Size (A°) | ρ(Ωcm)at 300K | ρ(Ωcm)at 23 OK | | Cu 2+) | 29 | 0.73 | 7.28 | 90.12 | | V(5+) | 23 | 0.54 | 13.37 | 71.53 | | Zn(2+) | 30 | 0.74 | 0.74 | 9.15 |
| | Table. 2:
| | Sample x | T0 (108 K) | p0 (10−13Ωcm) | | Tco > T>TN | T<TN | Tco> T>TN | T<TN | | Undoped | 1.88 | 4.24 | 19.1 | 0.006 | | Cu | 3.29 | 3.58 | 0.83 | 0.4 | | V | 1.07 | 3.31 | 3508 | 0.28 | | Zn | 1.87 | 4.27 | 8.64 | 0.002 |
| | Table. 3:
| | Sample X | S (A°) | R (nm) | W ¡eV) | | Tco > T>TN | T< TN | Tco > T>TN | T< TN | Tco >T >TN | T< TN | | Undoped | 7.17 | 5.47 | 7.58 | 7.09 | 0.18 | 0.22 | | Cu | 5.96 | 5.8 | 7.24 | 7.19 | 0.21 | 0.21 | | V | 8.68 | 5.95 | 7.96 | 7.24 | 0.16 | 0.21 | | Zn | 7.2 | 5.46 | 7.59 | 7.09 | 0.18 | 0.22 |
| | Table.4:
| | Sample x | T0(104K) | P0(105Ωcm) | | T<Tco | T<Tco | | Undoped | 4.79 | 1.08 | | Cu | 5.75 | 1.25 | | V | 4.49 | 5.62 | | Zn | 4.74 | 0.52 |
| |
|