|
|
|
|
Optimization of Injection System Parameters and EGR on Jatropha Biodiesel Engine using Taguchi Approach Ganapathy T.1,*, Balasubramanian R.2, Gakkhar R. P.1, Murugesan K.1 1I.C. Engines Laboratory, Mechanical & Industrial Engineering Department, Indian Institute of Technology, Roorkee, 2Department of Automobile Engineering, A. D. Patel Institute of Technology, Anand, Gujrat *Email ID: tganappathi@gmail.com
Abstract The diesel engine injection system parameters apart from the operating parameters such as load and speed significantly affect its performance and exhaust emissions. The effect is even adverse sometimes when the engine is tried with some alternative fuels, such as Jatropha biodiesel due to its physico-chemical properties. For better performance and to meet out stringent emission norms, these parameters have to be optimized. An experimental investigation and analysis carried out to simultaneously optimize injection system parameters and exhaust gas recirculation (EGR) levels of small direct injection diesel engine for lower fuel consumption and higher thermal efficiency and peak cylinder pressure is presented in this paper. During the experiments, the different parameters such as fuel type, injection timing, injector opening pressure, nozzle configuration, nozzle tip protrusion, percentage of exhaust gas recirculation (EGR), load torque and speed were changed. Taguchi's signal-to-noise ratio approach was applied to obtain an optimal setting of these parameters. From the experimental results and further analysis it is concluded that under 95% confidence interval the injection timing 340°CA, injector opening pressure 250 bar, nozzle configuration 5x0.18, EGR 0%, load torque 15Nm, speed 1800rpm with Jatropha biodiesel, gave the maximum peak cylinder pressure, while the lowest BSFC with diesel fuel was obtained with nozzle configuration 4x0.18, load torque 15Nm and speed 1800rpm and the highest brake thermal efficiency with nozzle configuration 4x0.18, tip protrusion 2mm, load torque 15Nm and speed 1800rpm. However, the significant control parameters responsible for brake thermal efficiency with their percentage contribution were load torque (79.13%), speed (17.54%), nozzle configuration (1.33%) and tip protrusion (0.96%). Top | Introduction Biodiesel has been popular as one among the alternatives to petroleum diesel for compression ignition engine applications because it has substantial prospect as a long-term replacement [1]. Although many raw materials have been found suitable for biodiesel production in different countries, only a very few and non-edible type such as Jatropha, Pongamia, mahua, neem, tobacco seeds etc. can be considered to be economically affordable to some developing nations like India in particular [2]. Being tropical country, India has a large potential to produce the Jatropha curcas plant [3]. Many experimental studies on Jatropha biodiesel as a diesel substitute have been reported in the literature [1-7]. The major properties of Jatropha biodiesel include comparable calorific value, high cetane number, high flash point, high density, high viscosity, high carbon residue and non-toxic. Table 1 shows the comparison of properties of Jatropha biodiesel with petroleum diesel. |
In general the higher density of Jatropha biodiesel makes the fuel spray narrow and its penetration deeper. The higher viscosity of Jatropha biodiesel can lead to poor atomization and mixture formation with air. This may result in slower combustion, lower thermal efficiency, higher emissions of unburned hydro-carbons (HC) and smoke, etc. The higher carbon residue of Jatropha biodiesel is due to its large molecular mass and chemical structure [4-5]. The higher carbon residue of Jatropha-oil leads to injector choking which in turn results in poor fuel atomization and consequently high smoke levels [6]. However, with advanced injection timing there will be better combustion and improved performance and also reduction in emissions. Significant improvement in performance and emissions can also be evident with increased injection pressure because of enhanced atomization at the nozzle outlet, more vapor distribution and better mixing. At higher injection pressures mean diameter of fuel droplet reduces resulting in better mixing and distribution. However, very high injection pressures lead to fine droplets, which can adversely affect fuel distribution in air [8-10]. |
Therefore, in order to have better fuel economy and performance of Jatropha biodiesel fueled diesel engine, the fuel injection system parameters namely injection timing, injector nozzle opening pressure, number of nozzle holes and its size (nozzle configuration) etc., at the specified engine operating conditions such as load and speed, need to be optimized. In the present work, such an attempt is made through experimental investigation that injection system parameters, percentage of exhaust gas recirculation and engine operating parameters have been varied and optimized. The present experimental test matrix has also included the two fuels, diesel and Jatropha biodiesel as a categorical control factor so as to test the significance of effect of fuel type. Taguchi design of experiments and signal-to-noise ratio method of analysis has been used in the investigation and analysis which are discussed in the following sections. The control factors with designated labels and their levels used for the present experimental study are listed in Table 2. The objective of the present work is to determine the optimal factor level settings of these control factors for an optimized response parameter (lowest brake specific fuel consumption and highest thermal efficiency). |
Top Selection of an Orthogonal Array In the present work, eight parameters as listed in Table 2 were selected in which one of the parameters is at two levels and the rest are at three levels each. Hence the design becomes a mixed level design. Taguchi design of experiments has been employed to reduce the total number of experiments to be conducted and to infer reasonable amount of results with these experiments. Therefore, L18 OA was chosen for experimentation. For the present case, the two level parameters has 1 degree of freedom and the three level parameters have 2 degrees of freedom each, totaling to a total degrees of freedom of 15 (=1*1+7*2). Thus the most appropriate array L18 (21x37) OA with 17 (=18-1) degrees of freedom [11] was chosen for the present design of experimental test runs. The array with assigned parameters to the respective columns is shown in Table 3. |
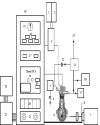
Top Experimentation The experiments were performed on a single-cylinder, four-stroke, air cooled, vertical, Greaves Cotton model GL 400 II A, diesel engine whose important specifications are listed in Table 4. The engine was loaded with AVL alpha – 20 eddy current dynamometer. The mass flow rate of intake air was measured with an orifice meter coupled to a manometer. The fuel consumption rate was determined using AVL fuel consumption meter. The exhaust gas recirculation (EGR) flow rate was measured with an orifice meter. The engine speed was measured by AVL inductive speed pick-up. The cylinder pressure was measured using AVL GM12D miniature pressure transducer. The schematic diagram of the experimental set-up employed in the present work is shown in Figure 1. The parameters namely brake specific fuel consumption (BSFC), brake thermal efficiency (BTE) and peak cylinder pressure have been investigated in the present study. The measured results of the eighteen experimental runs are given in Table 5. |
Top Statistical Analysis and Discussions Optimization of diesel engine injection system parameters and operating parameters by Taguchi method is an attempt not only to bring the average responses closer to the target value but also to simultaneously minimize the variation in response values. Whenever an experiment involves repeated observations at each of the trial conditions, the signal-to-noise ratio (SNR) analysis proves to be effective [11-13]. There are different SNR available depending on the type of characteristic, such as lower the better (LTB), nominal the best (NTB), or higher the better (HTB). In the present work lower the better (LTB) and higher the better (HTB) quality characteristics have been used. The SNR values are computed by using the following equations (1) and (2) respectively for LTB and HTB quality characteristics. |
where n is the number of values at each trial run condition and yi is the response variable. The negative sign is used to ensure that the largest value gives the optimum value for the response variable. The SNR values using Eq. (1) and (2) were computed for all the eighteen trial run conditions and the values are tabulated in Table 6. In Taguchi analysis, the average response refers to the average values of the response parameter at different levels. The average values of BSFC, BTE and Pmax at 3 levels were computed from the measured values and are given in Table 7. In the present investigation ANOVA is used to determine the significance of control factors and their interactions, and also to find out percentage contribution of the factors to the total variation of responses. The main effects of the control factors in terms of SNR are shown in figure 2. The average effect of each parameter on the response variables based on SNR can be seen from this figure, when the control parameters change from one level to another. It is clear from the figure 2. that engine operating parameters G and H, nozzle configuration (D) and fuel type (A) have more strong effect on brake specific fuel consumption than the rest of the parameters. Levels A1, D2, G3 and Η1 appear to be the best choice in terms of mean response and variation. The SNR for parameters suggest that levels B2, C2, E2, and F2 are better than any other levels of the parameters B, C, E and F respectively. These control factors and their significant effects on the response parameters were also verified by analysis of variance (ANOVA), which is performed separately for the individual response variables. These are illustrated in the following section. |
Top Analysis of Variance (Anova) ANOVA was carried out using the signal-to-noise ratio data from Table 6. The injection system parameters, EGR and engine operating parameters, which have the most significant effects on response parameters, are identified and also the contribution of these effects to the total variation of the response variables (BSFC, BTE and Pmax) are quantified. The results of ANOVA showing the percentage contribution of control factors to the response variables are shown in Table 8. Insignificant effects and very less percentage contributions of some factors are pooled as an error term. One can observe from Table 8 that the significant control factors for BSFC, in the order of contributing percentages, are load torque, speed, fuel type and nozzle configuration. The most significant factor is load torque, which accounted for 74.55% of the total variation observed. It is well known fact that the load has got great influence on specific fuel consumption in internal combustion engine. Speed (16.53%), fuel type (5.86%) and nozzle configuration (1.25%) are in second, third and fourth position of order in significance level. |
It is observed from Table 8 that the significant factors which are responsible for improving the brake thermal efficiency, in the order of their percentage contribution, are load torque (76.13%), engine speed (17.54%), nozzle configuration (1.33%) and tip protrusion (0.96). And these values for peak cylinder pressure are speed (40.95%), load torque (17.33%), injection timing (15.47%), nozzle configuration (7.83%), EGR (6.59%), fuel type (5.71%) and injector opening pressure (4.62%). Percent contribution of pooled error as shown in Table 8 were found to be less than 2% and therefore it can be claimed that the analysis could effectively identify the significant control factors. Once the significant parameters and their levels are identified, the predicted average optimum values of the response variables (BSFC, BTE and Pmax) are computed at 95% confidence interval and they were summarized and listed in Table 9 with their optimal factor level settings. Also one can note from Table 9 that the confirmation run values of the response variables are well within the predicted ranges. |
Top Conclusion The effect of injection system parameters (static injection timing, injector opening pressure, nozzle configuration, nozzle tip protrusion), engine operating parameters (load torque and speed) and exhaust gas recirculation (EGR) on brake specific fuel consumption, brake thermal efficiency and peak cylinder pressure of direct injection compression ignition engine fueled with diesel and Jatropha biodiesel were experimentally investigated using Taguchi design of experiments and analysis methods. The significance of effects of control parameters and their levels in addition to percentage contribution of these effects to response variables variation were determined and quantified using ANOVA. The advance or retard of injection timing by 5°CA from the rated value results in no significant changes in brake specific fuel consumption and brake thermal efficiency, however advanced timing's (340°CA) contribution to increasing the peak cylinder pressure is 15.47%. Also the effect of change of injector opening pressure, on BSFC and BTE is insignificant but for Pmax its contribution is 4.62%. As far as nozzle configuration is concerned, it contributed 1.25% for minimizing fuel consumption and 1.33% and 7.83% for maximizing the brake thermal efficiency and peak cylinder pressure respectively. The decrease of tip protrusion does not have any significant contribution to fuel consumption and peak cylinder pressure however it contributed little (0.96%) to improve the brake thermal efficiency. The exhaust gas recirculation also doesn't take active contribution to BSFC and BTE but for P its contribution is 6.59%. The optimal control factors settings for low BSFC and high BTE and Pmax values of responses with 95% confidence levels are (A1, D2, G3, H1), (D2, E1, G3, H1) and (A2, B1, C2, D1, F1, G3, H1) respectively. The average values of the response parameters from confirmation experiments are found to be well within the confidence interval of predicted optima of these response parameters. |
Top Figures | Figure 1.: Schematic diagram of experimental set-up
? ? ? ? ?1. Diesel tank, 2. Jatropha biodiesel tank, 3. AVL Fuel consumption meter, 4. Intake air manometer, 5. Intake air surge tank, 6. Test engine, 7. AVL Eddy current dynamometer, 8. TDC, crank angle, and speed pick –ups, 9. AVL 4000 Light Di Gas Analyser, 10. AVL 437 Smoke meter, 11. Exhaust gas surge tank, 12. Exhaust gas manometer, 13. Exhaust gas outlet, 14. AVL Control panel, 15. Lubricant pressure gauge, 16. Lubricant, cooling water, and exhaust gas temperature indicators, 17. Fuel consumption meter (cc, time indicator), 18. Dynamometer controller - 201 A, 19. Torque and speed indicators, 20. Signal conditioning rack, 21. Throttle actuator, 22. Data acquisition system, 23. Personal computer.
|  | |
| | Figure 2.: Main effects plot of control factors Pmax, BTE and BSFC
|  | |
|
Tables | Table 1.: Properties of test fuels
| | Fuel | Diesel | Jatropha biodieisel | | Density at 15°C (kg/m3) | 840 | 880 | | Viscosity at 37.8°C (cst) | 4.23 | 5.25 | | Calorific value (Mj/kg) | 43.25 | 39.5 | | Diesel index | 51.73 | 52.88 | | Flash point (CC) | 52 | 174 |
| | | Table 2.: Control factors and their levels
| | Parameter | Designation | Level 1 | Level 2 | Level 3 | | Fuel type | A | Diesel | Jatropha biodiesel | * | | Injection timing (CAD) | B | 340 | 345 | 350 | | Injector opening pressure (bar) | C | 240 | 250 | 260 | | Nozzle configuration | D | 5×0.18 | 4×0.18 | 4×0.25 | | Nozzle tip protusion (mm) | E | 3.5 | 2 | 1 | | Exhaust gas recirculation (%) | F | 0 | 10 | 20 | | Load torque (Nm) | G | 5 | 10 | 15 | | Speed (rpm) | H | 1800 | 2500 | 3200 |
| | | Table 3.: Experimental test layout (21×37) L18 OA
| | L18OA | Inner array | | BTE L2OA outer array | | Trial number | A | B | C | D | E | F | G | H | Z | 1 | 2 | | 1 | 2 | 3 | 4 | 5 | 6 | 7 | 8 | | | | | 1 | 1 | 1 | 1 | 1 | 1 | 1 | 1 | 1 | | 2.5697 | 22.5178 | | 2 | 1 | 1 | 2 | 2 | 2 | 2 | 2 | 2 | | 31.1306 | 31.2748 | | 3 | 1 | 1 | 3 | 3 | 3 | 3 | 3 | 3 | | 26.0114 | 25.7347 | | 4 | 1 | 2 | 1 | 1 | 2 | 2 | 3 | 3 | | 28.7785 | 29.0553 | | 5 | 1 | 2 | 2 | 2 | 3 | 3 | 1 | 1 | | 23.2961 | 23.2442 | | 6 | 1 | 2 | 3 | 3 | 1 | 1 | 2 | 2 | | 28.1040 | 28.2482 | | 7 | 1 | 3 | 1 | 2 | 1 | 3 | 2 | 3 | | 25.6424 | 25.4579 | | 8 | 1 | 3 | 2 | 3 | 2 | 1 | 3 | 1 | | 31.1306 | 31.2863 | | 9 | 1 | 3 | 3 | 1 | 3 | 2 | 1 | 2 | | 22.0509 | 21.9788 | | 10 | 2 | 1 | 1 | 3 | 3 | 2 | 2 | 1 | | 29.5413 | 29.4276 | | 11 | 2 | 1 | 2 | 1 | 1 | 3 | 3 | 2 | | 31.7190 | 31.9557 | | 12 | 2 | 1 | 3 | 2 | 2 | 1 | 1 | 3 | | 20.0982 | 19.9972 | | 13 | 2 | 2 | 1 | 2 | 3 | 1 | 3 | 2 | | 31.2456 | 31.4823 | | 14 | 2 | 2 | 2 | 3 | 1 | 2 | 1 | 3 | | 19.5932 | 19.6942 | | 15 | 2 | 2 | 3 | 1 | 2 | 3 | 2 | 1 | | 31.2456 | 31.3592 | | 16 | 2 | 3 | 1 | 3 | 2 | 3 | 1 | 2 | | 22.1323 | 22.0139 | | 17 | 2 | 3 | 2 | 1 | 3 | 1 | 2 | 3 | | 25.3499 | 25.4509 | | 18 | 2 | 3 | 3 | 2 | 1 | 2 | 3 | 1 | | 32.2113 | 32.2113 |
| | | Table 4.: Principal Specifications of test engine
| | Engine | Greaves Cotton | | Model | GL 400 II A | | No. of cylinders | 1 | | Bore (mm) | 86 | | Stroke (mm) | 68 | | Displacement (cubic cm) | 395 | | compression ratio | 18 | | Maximum power (kw) at rated rpm | 5.59 | | Rated rpm | 3600 |
| | | Table 5.: Measured values of responses from L18 OA
| | Run No. | BTE (%) | Pmax (bar) | BSFC (kg/kWh) | | 1st | 2nd | 1st | 2nd | 1st | 2nd | | 1 | 22.5697 | 22.5178 | 58.4539 | 58.7895 | 0.3688 | 0.3696 | | 2 | 31.1306 | 311.2748 | 54.9408 | 55.2365 | 0.2674 | 0.2661 | | 3 | 26.0114 | 25.7347 | 44.0797 | 45.2145 | 0.3200 | 0.3234 | | 4 | 28.7785 | 29.0553 | 49.3108 | 50.1234 | 0.2892 | 0.2865 | | 5 | 23.2961 | 23.2442 | 49.7263 | 50.6987 | 0.3573 | 0.3581 | | 6 | 28.1040 | 28.2482 | 48.4614 | 47.9986 | 0.2962 | 0.2947 | | 7 | 25.6424 | 25.4579 | 39.1326 | 40.1256 | 0.3246 | 0.3270 | | 8 | 31.1306 | 31.2863 | 57.6772 | 58.1254 | 0.2674 | 0.2660 | | 9 | 22.0509 | 21.9788 | 41.7805 | 42.0125 | 0.3775 | 0.3787 | | 10 | 29.5413 | 29.4276 | 60.7442 | 60.5698 | 0.3085 | 0.3097 | | 11 | 31.7190 | 31.9557 | 61.4834 | 62.3564 | 0.2873 | 0.2852 | | 12 | 20.0982 | 19.9972 | 50.0364 | 50.6987 | 0.4535 | 0.4558 | | 13 | 31.2456 | 31.4823 | 52.5437 | 51.5632 | 0.2917 | 0.2895 | | 14 | 19.5932 | 19.6942 | 43.8567 | 43.5698 | 0.4652 | 0.4628 | | 15 | 31.2456 | 31.3592 | 60.1855 | 60.2589 | 0.2917 | 0.2906 | | 16 | 22.1323 | 22.0139 | 38.4354 | 39.0045 | 0.4118 | 0.4140 | | 17 | 25.3499 | 25.4509 | 51.1409 | 52.0265 | 0.3595 | 0.3581 | | 18 | 32.2113 | 32.2113 | 60.5113 | 61.1245 | 0.2829 | 0.2829 |
| | | Table 6.: SNR table of responses
| | Run No. | BTE | Pmax | BSFC | | 1 | 27.0605 | 35.3611 | 11.6645 | | 2 | 29.8838 | 34.8211 | 14.4877 | | 3 | 28.2566 | 32.9938 | 12.8605 | | 4 | 29.2227 | 33.9292 | 13.8267 | | 5 | 27.3360 | 34.0150 | 11.9399 | | 6 | 28.9975 | 33.6660 | 13.6015 | | 7 | 28.1477 | 31.9582 | 12.7517 | | 8 | 29.8854 | 35.2536 | 14.4893 | | 9 | 26.8543 | 32.4435 | 11.4582 | | 10 | 29.3918 | 35.6576 | 13.2080 | | 11 | 30.0586 | 35.8360 | 13.8747 | | 12 | 26.0412 | 34.0425 | 9.8574 | | 13 | 29.9284 | 34.3278 | 13.7446 | | 14 | 25.8644 | 32.8121 | 9.6806 | | 15 | 29.9115 | 35.5951 | 13.7277 | | 16 | 26.8772 | 31.7580 | 10.6934 | | 17 | 28.0968 | 34.2493 | 11.9130 | | 18 | 30.1602 | 35.6803 | 13.9764 |
| | | Table 7.: Average SNR values of response parameters
| | Parameter | Level | BTE | Pmax | BSFC | | Fuel type | 1 (Diesel) | 28.4049 | 33.8268 | 13.0089 | | 2 (Jatropha biodiesel) | 28.4811 | 34.4398 | 12.2973 | | Inj. timing (CAD) | 1 (340) | 28.4487 | 34.7853 | 12.6588 | | 2 (345) | 28.5434 | 34.0576 | 12.7535 | | 3 (350) | 28.3369 | 33.5571 | 2.5470 | | Inj. open.pr.(bar) | 1 (240) | 28.4381 | 33.8320 | 12.6481 | | 2 (250) | 28.5208 | 34.4978 | 12.7309 | | 2 (260) | 28.3702 | 33.0702 | 12.5803 | | Nozzle config. | 1 (5×0.18) | 28.5341 | 34.5690 | 12.7441 | | 2 (4×0.18) | 28.5829 | 34.1408 | 12.7930 | | 3 (4×0.25) | 28.2121 | 33.6902 | 12.4222 | | Tip protru. (mm) | 1 (3.5) | 28.3815 | 34.2190 | 12.5616 | | 2 (2) | 28.6370 | 34.2333 | 12.8470 | | 3 (1) | 28.3106 | 33.9478 | 12.5207 | | EGR (%) | 1 (0) | 28.3350 | 34.4834 | 12.5450 | | 2 (10) | 28.5629 | 34.2240 | 12.7729 | | 3 (20) | 28.4312 | 33.6927 | 12.6413 | | Load torque (Nm) | 1 (5) | 26.6722 | 33.4053 | 10.8823 | | 2 (10) | 29.0715 | 34.3246 | 13.2816 | | 3 (15) | 29.5883 | 34.6701 | 13.7954 | | Speed (rpm) | 1 (1800) | 28.9576 | 35.2604 | 13.1676 | | 2 (2500) | 28.7666 | 33.8087 | 12.9767 | | 3 (3200) | 27.6049 | 33.3308 | 11.8150 |
| | | Table 8.: Percent contribution of control factors
| | Parameter | Label | % Contribution | | | BTE | Pmax | BSFC | | Fuel type | A | | 5.71 | 5.86 | | Injection timing | B | | 15.47 | | | Injector opening pressure | C | | 4.62 | | | Nozzle configuration | D | 1.33 | 7.83 | 1.25 | | Tip protrusion | E | 0.96 | | | | EGR | F | | 6.59 | | | Load | G | 79.13 | 17.33 | 74.55 | | Speed | H | 17.54 | 40.95 | 16.53 | | Interaction effect | A×B | | | | | Pooled error (%) | | 1.04 | 1.5 | 1.81 |
| | | Table 9.: Optimum factor level settings
| | Parameter | Label | BTE | Pmax | BSFC | | | (%) | (bar) | (kg/kWh) | | Fuel type | A | | Jatroph | Disel | | Injection timing (CAD) | B | | 340 | | | Injector opening pressure (bar) | C | | 250 | | | Nozzle configuration | D | 4×0.18 | 5×0.18 | 4×0.18 | | Tip protrusion (mm) | E | 2 | | | | EGR (%) | F | | 0 | | | Load torque (Nm) | G | 15 | 15 | 15 | | Speed (rpm) | H | 1800 | 1800 | 1800 | | | 30.1058 | 37.094 | 13.9174 | | Predicted range | | 30.7616 | 38.7184 | 15.6938 | | Confirmation run | | 30.4502 | 37.0961 | 14.8701 |
| |
| | |
|
|
|