|
|
|
|
Understanding user participation and involvement in ERP use Kanungo Shivraj, Bagchi Shantanu Department of Management Studies Indian Institute of Technology New Delhi-110 016. Abstract User participation and involvement are being studied in the context of enterprise resource planning (ERP) systems and the research findings based on the data gathered till date are presented in this paper. Given the enterprise-wide scope of these systems and their high level of complexity, in addition to a different implementation methodology, differences in the nature of user participation and involvement were expected. Using Hartwick and Barki's model based on the theory of reasoned action a revised model was developed and tested empirically. While Hartwick and Barki's model explains user behavior vis-à-vis user participation and involvement, a more parsimonious model demonstrates that the usage dynamics in ERP implementation are indeed different. Given the mandatory nature of ERP usage, the subjective norm influencing behavioral intention concerning use may well be extra-organizational. Top Keywords enterprise resource planning, information system user behavior. Top | Introduction ERP (enterprise resource planning) denotes the broad set of activities supported by multimodule application software that helps an organization manage its business, including production/service planning, purchasing, maintaining inventories, interacting with suppliers (or customers), providing customer service and tracking orders. ERP, as a software package, provides an information structure that is isomorphic to the business processes of the entire organization. While the concept of the ERP is very attractive for organizations, most organizations have realized that while the potential benefits of ERP implementation are significant, the costs of failure are equally high. Davenport (1998) reports on such ERP failures. Organizations tend to falter in the absence of an alignment between its human and business systems and the new technological system. |
Since ERP implementation is a costly and timeconsuming project, its success is of immense importance to the organization considering the possibility of high returns that the ERP can possibly lead to. This study of determinants of system usage in ERP was taken up since we failed to uncover of any other such study on ERP. It has emerged that ERP constitutes a separate class of applications by itself. While an ERP can be considered a “packaged application”, it is significantly different in terms of scope and functionality from traditional packages. For instance Montazemi et al. (1996) have analyzed factors affecting end-user packages like word processors and personal database products. For such “packages,” their effective use tends to dependent on ease of use and perceived usefulness (Adams, et al., 1992; Bergeron, et al.1990; Davis, et al. 1989). While the focus of such packages has been on user-centric aspects like personal productivity, the distinguishing feature of ERP systems is the claim to directly make an impact on organizational effectiveness and their enterprise-wide emphasis. |
In some instances, ERP systems are implemented with an implicit agenda while being justified using well accepted criteria like inventory reduction, improved cash management, increased revenue and profits, reduced transportation, logistics and information technology costs. The implicit agenda may include a solution for chronic organizational affliction with heterogeneous and diverse legacy systems, ERP as a Y2K solution or the introduction of new hardware throughout the organization as an upgrade for the ERP. This results in implementing an ERP for the inappropriate reasons. In addition, given the phenomenal potential benefits that ERP promises, the enormous organizational commitments and energy required to successfully implement an ERP system often get downplayed. Procurement dynamics for ERP are also different when compared to those of customized solutions. Given the high stakes associated with ERP, decisions regarding ERP are generally made by top management in association with a third party consultant and the IT-head. Variants to this decision archetype could be a situation where the IT-head is not consulted. This is typically the situation where individual units or divisions have to comply with a corporate decision to implement a specific ERP system. Given the pre-fabricated nature of ERP software, implementation characteristics also differ. For instance, while customized application development emphasizes user-involvement at the analysis and design stage, ERP implementation requires users to concentrate far more on business process specifications and mappings. |
Given these differences, the aim of our research was to identify variables/constructs which are needed to explain system use in ERP and explain how each of these variables/constructs influence each other and final system usage. Similar studies have been carried out for various information systems and software packages like spreadsheets, e-mail software, decision support systems, expert systems, etc. However, studies of this kind for an enterprise wide information system like ERP has not been undertaken. Due to the difference in scope of influence of ERP, as compared to other information systems, the nature and degree of influences among the variables may be different. Given the existing body of knowledge on determinants of IT use, and the theoretical models verified in different domains, we used structural equation modeling in an attempt to validate one such theoretical model in the ERP domain. Our constructs of focus were user participation and user involvement. |
We undertook this study to obtain a better understanding of the factors, and their interplay, which influence the usage of such large organization-wide systems. The objective of our work is to help organizations to better plan for, manage and increase effectiveness of their ERP projects. |
Top Theoretical Framework A number of studies have been carried out which have identified factors that influence the usage of information systems implemented in organizations by users and the under structure by which these influences are exercised by these factors. Some of these predominant behavioral theories are detailed below. We attempted to incorporate past findings of relevance from prior research into our research model. Our model of choice is based on theory of reasoned action, which states that one's action (in this case, ERP use) is a function of one's intention. |
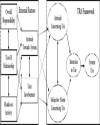
Theory of Reasoned Action Fishbein and Ajzen (1975) introduced the theory of reasoned action (TRA) as a result of their work on persuasion theory and determinants of volitional behavior respectively. This theory (Figure 1) addresses factors that contribute to individual behavior. This is a theory that is general enough to be applied to various organizational contexts.
TRA states that the most immediate determinant of behavior is the intention to perform that behavior. In other words, in order to act, one must first intend to act and, as such, no action is carried out without an intention to do so. Consequently, this leads to the notion that if one were to persuade intention, action would, as a result, be altered. The theory is broken into two unique factors that contribute to behavior: individual attitude and subjective norm. Attitudes are “enduring, learned predispositions toward responses directed at some object, person, or group (Zimbardo, 1969).” An individual's attitude acts as a coinfluencer with her subjective norm to determine her behavior. Subjective norm is the perception of an individual regarding how a certain behavior would be felt by people who are important in that individual's life. In particular, our work is based on the work of Hartwick and Barki (1994a, 1994b) who, using the theory of reasoned action as the theoretical base, have conducted their research exercise to study usage of mail software. For the external variables that affect attitude towards the system use and subjective norm of use, they provided refinement of constructs like user participation and user involvement. User participation and user involvement have been distinguished. While participation can be considered to influence user involvement, involvement has little effect on participation. The model used by Hartwick and Barki is shown in Figure 2.
Our research was driven by the fact that since ERP systems are different (larger, more complex, and tend to encapsulate industry “best practices”) the nature of user participation, and consequently, user involvement, would be different. Differences in the nature and role of user participation, owing to differences in the nature and type of systems, have been documented in prior research. Lu and Wang (1997) suggest a changing nature of participation as the nature and maturity of information systems change. Garrity's (1994) research, though conducted in a traditional SDLC context, also supports the contention that the relationship of user participation to perceived usefulness is modulated by the type of system. Based on Choe's (1998) findings, we should expect improved usage of ERP systems as a result of user participation given the high task uncertainty in such projects. However, findings of Hudson and Beeler (1997) indicate that the effect of user participation is dependent on the extent to which users perceive a noticeable degree of instrumental control over the decision outcome, may point to less effective usage of ERP systems. The existence of situation-specific differences in the effectiveness of user participation based on task and system complexity (McKeen and Guimaraes, 1997) scale (See Appendix A). The questionnaires were distributed among ERP users in five organizations. The organizations chosen belong to diverse industries (necessary to prevent industry bias creeping in the study). We selected organizations where at least five major modules of ERP were implemented and the point to the fact that it is important to obtain a better understanding of the nature of user participation in the ERP lifecycle. Top The Study Our research model for this study was based on the TRA. We made every effort to keep the research method similar to the one used by Hartwick and Barki (1994a). We used the same instrument as employed by Hartwick and Barki. Having a validated questionnaire for the model selected was an important criterion for us. It allowed us to circumvent the requirement of carrying out exploratory factor analysis on constructs and manifest variables (variables used for measuring the constructs and are measured directly through the questionnaire) present in the identified model. The variables measured using the questionnaire (the manifest variables) are either on a nominal scale or an ordinal systems were “live.” One of the two leading ERP systems is implemented in each of these organizations. The ERP project leader was chosen as the organizational contact person. Till date, a total of 186 questionnaires have been distributed in the organizations. Project leaders have been requested to distribute the questionnaires to all the users of ERP in their organization. So far, 49 valid and usable responses have been received. This usable response set contained responses of 34 executives, 10 deputy managers, one senior manager, 3 general managers, and one executive director. |
As the model to be studied was identified and what needed to be done was to fine-tune the model for studying ERP usage, a model development strategy was adopted (exploring alternate model specifications based on the same theoretical foundation). A confirmatory factor analysis was carried out between the manifest variables and constructs present in the model. This was done as a part of the model development strategy to study the extent to which the manifest variables measure the associated constructs in the new setting (study of ERP usage). Causal paths among constructs were identified which need to be studied in the path analysis exercise. The objective here was to identify the significant paths and the extent to which the exogenous constructs (the causes) influence the endogenous constructs (the effects). For this, and for the previous step, the PROC CALIS module of SAS was used. |
In terms of attitude toward the system and attitude toward system use, almost all respondents reported positive scores toward ERP. In almost all responses, in subjective norm of use, supervisors expected the respondent to be a frequent as well as a heavy user of the system. This was not unexpected since ERP, being very expensive to acquire and implement, its effectiveness is of prime concern for the employees. Hence it is a desire of the top management that the executives extensively use the system. Only in three cases was “heavy usage” not advocated by the superiors (but “frequent usage” was). |
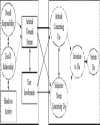
Top Analysis Analysis Using Structural Equation Modeling The structural equation modeling exercise comprised analysis of the measurement model and analysis of the path/structural model. The measurement model analysis aimed at studying the extent to which the underlying constructs explained the variations in the manifest variables. The structural model was used to study the hypothesized influence paths among the latent variables. Analysis of the Path Model The main methodological component of our research was to identify the structural configuration of the causal paths that exist between the constructs and arrive at a model that is as parsimonious as possible (having the least number of causal and co-variant paths) and exhibits an acceptable fit with the sample data. The path analysis procedure was carried out by testing three path models with the sample data. The first model was the standard path model of the TRA while the second model was the model tested and recommended by Hartwick and Barki (1994a). The third is the modified model that was arrived at by deletion of certain paths which were found to be non-significant in the analysis phase of the first two models. The standard model configuration is shown in Figure 3. All latent constructs are shown as ellipses while the manifest structural variables are in rectangles.
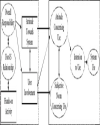
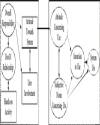
The model proposed by Hartwick and Barki was analyzed as Model 2 and is shown in Figure 4. A modified model was developed by elimination of certain causal paths in Hartwick and Barki's model (Figure 5).
In path analysis all exogenous (independent) variables, with the exception of error terms, are allowed to co-vary among one another. Also the variances of all the exogenous variables need to be estimated in the analysis process. An error term is associated with each endogenous (dependent) variable, be it a latent endogenous construct or a manifest variable. For each endogenous variable a path equation is fed to the computer. Each path shown in the diagram above corresponds to a path co-efficient in a path equation. The detailed analysis and discussion of the results of modeling are in the Appendix B. Top Discussion The presence of a good fit between the sample data and the TRA models, both the standard version as well as the version by Hartwick and Barki, show that ERP usage in organizations have quite a few aspects in common with usage of other information systems deployed in organizations. The previous models were tested in different scenarios (primarily in Canada and the USA). The proposed models perform well in the Indian context as well. However, there are a few observations with respect to the difference in significance of paths between constructs. For instance, the explained variance of subjective norm concerning use by other constructs is very small. In addition, the path co-efficients are not statistically significant. This can be verified by examining the t-values and the R2 values for the three tested models. The possible explanation for this difference is discussed below. |
Firstly, an ERP project, being expensive in terms of both hardware and software, makes it imperative for the organization undertaking it to make it a success. Thus, senior managers tend to exert pressure on subordinates to use the software package for their daily office work (if the employee, on whom the pressure is being put, does a job that requires ERP package usage). Users, if they are required to use ERP modules in their job, are not given the option of choosing whether or how to use the ERP system. As a result, it is felt that final “system usage” will be affected by “subjective norms” and, hence, the causal path from “subjective norm concerning use” to “system usage” was not deleted from Model 3 even though it was not found to be statistically significant. During follow-up interviews that we conducted at random, it was reported by eighteen out of twenty respondents that one of the major reasons why users used ERP was because senior managers and ERP project leaders ensured compliance in the usage of ERP software. Bypassing ERP, if it was required for the user's job, was not an available option regardless of any inadequacies in the ERP. Most organizations used “work-arounds” to customization of the software. |
Secondly, and importantly, in the present scenario in India, ERP is a genre of systems that many individuals prefer to be associated with. There is a huge demand for individuals with “ERP experience.” Hence, usage of an ERP package can be perceived by the employees to be beneficial to them in their carriers. Hence the prevailing market conditions and opportunities encourage individuals to use the ERP software. |
To understand the absence of the linkage between user involvement and subjective norm, it is useful to conceptualize subjective norm as the formalized and aggregated expectancy structure in an organization. Involvement is best conceptualized as intrinsic involvement, which refers to the association between objects, actions, or events and self-relevant goals and values (Jackson et al., 1997). Intrinsic involvement is a function of one's goals and values and thus tends to endure throughout the development process. In the case of ERP, intrinsic involvement for key users may start before the ERP project and may extend well beyond its completion. When the opportunities for significant career advancement present themselves an individual tends to be far more involved since ERP assumes significant consequences. Since subjective norm has to do with what is expected of an individual inside an organization and, since in this case, involvement tends to derive from extra-organizational aspects, it can be understood why there is an absence of a relationship between subjective norm and involvement. Similarly, user involvement does not influence the attitude concerning use. These results are in agreement with the conclusions of Hartwick and Barki (1994a) who reported that “for the mandatory group no significant relationship was found between user participation and other model variables. Further, user involvement also failed to influence attitude and subjective norm concerning system use.” |
It was found that the causal link between “overall responsibility” and “user involvement” was statistically not significant. However it was felt that in the ERP scenario this causal path should exist. During follow up interviews with respondents it emerged that overall responsibility in case of ERP is limited to project manager, business process analysts, etc. Individuals who have been involved in such roles do take more interest in the ERP software. A possible reason for the non-significance of this path could be attributed to the fact that almost 50% of our respondents were not fully involved in the ERP implementation process but did give favorable responses to “user involvement questions”. During follow-up interviews a majority of these respondents were far less enthusiastic about ERP. Some respondents provided fairly intense feedback of the form — “I don't care about ERP. I was not involved in the implementation stage at all.” We believe that the fear of the responses being leaked to management may have led to these respondents to give favorable responses. |
We had started this study on the premise that in the case of ERP systems, usage is mandated. The link between subjective norm concerning use and system use is evidence of such a lack of choice available to the user. The link can be interpreted as that users use the system because they are expected to. We would however like to conjecture an alternate explanation for such a link. While our instrument did not capture extra-organizational subjective norms, it is possible that given ERP-related opportunities (as mentioned above) that some users were influenced to use the ERP favorably (despite their non-involvement) because of such extraorganizational normative beliefs regarding professional opportunities. |
Most other causal influences can be explained as per the theory of reasoned action. The relevant explanations provided by Hartwick and Barki also hold good in this case. |
Top Conclusion The present study shows that the model of theory of reasoned action, with further specifications by Hartwick and Barki, can be used for studying ERP usage in the Indian scenario. The main finding arising out of this study was that while a theoretical model does explain user behavior vis-à-vis user participation and involvement, a more parsimonious model demonstrates that the dynamics in ERP implementation are indeed different. |
This finding has significant implications for the world of work. Enormous investments are being made by organizations to implement enterprisewide information systems. The motivations for such systems may be varied but their utility to the organizations can not be undermined. Yet, if organizations are not able to elicit meaningful and appropriate user involvement, user participation (which could be superficial) will tend to dilute the potential impact of the ERP project. The source of such inadequate participation could well be the nature of the ERP implementation process itself wherein users are involved only after a decision to implement a certain package has already been taken. When Jenson and Johnson (1999) conclude that “most problems seem to result from users trying to map a previously ill-behaved system to work within the structure of the ERP system,” they are describing a framework where users tend to perceive the situation as - here is the software, make sure it works. User involvement has been linked to information systems success (Hwang and Thom, 1999; Yoon et al. 1995). The least controversial measure of information system success has emerged to be user satisfaction with information system (Glorfeld and Cronan, 1993; Tan and Lo, 1990; Tait and Vessy, 1988). Information systems success has been linked with IS use (Downing, 1999). Hence, the extent and nature of ERP use will determine ERP success. |
Newman and Noble (1990) have found that conflict in user involvement may result from the development of complex systems in which analysts and users have semantic differences, users have conflicting information requirements, and where users may not have sufficient influence or power to control the design process. While the traditional notions of design might be absent in ERP projects, the very nature of user participation without much choice leaves ample scope open for users to perceive lack of influence or power to determine a solution framework that they seem to be designing for themselves. Robey and Farrow (1982) have reported that participation without influence may not lead to the successful resolution of a conflict between analysts and users. The ERP analogy to the Robey and Farrow reporting is the conflict between implementation partners and users. Users tend to retain most of the existing processes while implementation partners encourage organizational process changes using varied logic including that of incorporating world-class business practices into the organization. Management tends to minimize the implementation cycle time and hence tend to nod in favor of accepting an ERP system with minimal customization. This situation tends to strip users of their influence in determining the degree of customization to an ERP. This leads to inappropriate involvement and consequently sub-optimal use. In the long run, the much anticipated ERP-benefits tend to be diminished. |
At this stage the main managerial implication that emanates from our findings is that users’ participation and involvement need to be moved upstream in the ERP implementation cycle. There are many alternatives to achieving this. While direct user participation for all may not be possible, key user representatives must be present when vendor presentation and third party analyses are being made. Key user representatives need to go back to their constituents to obtain feed back on system alternatives and eventual system configuration. This is important since functionality fit is a critical criterion in ERP selection and implementation. Some organizations have arranged a series of pre-ERP training programs to prepare users for impending changes. Users in organizations that have established information systems that were custom-built tend to expect participation or roles based on prior such experiences. Selected organizations have held training sessions and internal seminars to help users redefine their expectations and deconstruct their roles that originally involved interacting with analysts to develop screen prototypes and validate high-level data flow diagrams. Users are sensitized to focus on core process modeling and defining new or refined processes. |
One shortcoming in the present project was the small sample size. In India, the number of companies, which have implemented ERP or are in the process of implementation, are few. Hence, adequate number of responses (which need to be around 150 to 200 for a structural equation modeling exercise) could not be collected. The study was carried out using a total of 48 responses that gave a d.f. = 57 to the measurement model. Hartwick and Barki (1994a) also report that early in the information system development process, subjective norm is the crucial construct that would determine system usage. When the system becomes operational, attitude is the crucial determinant of usage. Additional data will need to be collected in a longitudinal study to assess how user participation and involvement can be better harnessed. |
Top Figures | | Figure 2: The TRA Framework used by Hartwick and Barki, (1994a)
|  | |
| | Figure 3: The standard model used for the path analysis (Model 1)
|  | |
| | Figure 4: The model proposed by Harwick and Barki
|  | |
| | Figure 5: The modified model for ERP use
|  | |
|
Tables | Table 1: Goodness of fit indicators for the measurement model
| | Chi Square | 77.1885 | | Bentler's CFI | 00.9415 | | Bonnett & Bentler's NFI | 00.8922 | | d.f. | 57.0000 |
| | | Table 2: Latent constructs with indicator reliability scores
| | Latent Construct | Manifest Variable | Standard Loadings | Errors | Error Variance | Indicator Reliability |
| | V1 | 0.8149 | E1 | 0.33594 | 0.6641 | | F1 | | V2 | 0.6720 | E2 | 0.54847 | 0.4515 | | V3 | 0.8430 | E3 | 0.28935 | 0.7106 | | F2 | | V4 | 0.6798 | E4 | 0.53787 | 0.4621 | | V8 | 0.8817 | E8 | 0.22261 | 0.7774 | | F3 | | V9 | 0.8006 | E9 | 0.35904 | 0.6410 | | V10 | 0.6910 | E10 | 0.52252 | 0.4775 | | F4 | | V11 | 0.8185 | E11 | 0.33006 | 0.6699 | | V12 | 0.7455 | E12 | 0.44423 | 0.5558 | | F5 | | V13 | 0.9010 | E13 | 0.18820 | 0.8118 | | V14 | 0.8899 | E14 | 0.20808 | 0.7919 | | F6 | | V15 | 0.7189 | E15 | 0.48318 | 0.5168 |
| | | Table 3: Latent constructs with variance extracted estimates
| | Latent Construct | Alpha | Variance Extracted Estimate |
| | F1 | 0.7143 | 0.5578 | | F2 | 0.7326 | 0.5811 | | F3 | 0.7371 | 0.5864 | | F4 | 0.7623 | 0.6198 | | F5 | 0.8295 | 0.7092 | | F6 | 0.7162 | 0.5592 |
| | | Table 4: Measures of model fit for the three models
| | Model 1 | Model 2 | Model 3 |
| | Goodness of Fit Index | 0.81 | 0.80 | 0.80 | | Chi Sq. | 93.53 | 100.38 | 99.37 | | Bentler's CFI | 0.95 | 0.94 | 0.95 | | Bonnett & Bentler's NFI | 0.79 | 0.78 | 0.78 | | Bonnett & Bentler's NNFI | 0.93 | 0.92 | 0.93 | | d.f. | 76.00 | 79.00 | 82.00 |
| | | Table 5: Measures of model parsimony
| | Description | d.f. | Parsimony ratio | NFI | PNFI | Chi-square |
| | Model 1 (standard model) | 76 | 0.724 | 0.7776 | 0.563 | 93.5289 | | Model 2 (Barki's model) | 79 | 0.752 | 0.777 | 0.585 | 100.387 | | Model 3 (Mod. model) | 82 | 0.781 | 0.779 | 0.609 | 99.379 | | Null model | 105 | 1.000 | – | – | 449.921 | | Measurement Model | 57 | | | | 77.189 |
| | | Table 6: Fits for the structural portion of the model
| | Description | RNFI | RPR | RPNFI |
| | Model 2 (Barki's model) | 0.997 | 0.458 | 0.4568 | | Model 3 (Modified model) | 1.008 | 0.521 | 0.5250 | | Model 1 (Standard model) | 1.008 | 0.396 | 0.3988 |
| | | Table 7: Test for significance of difference of chi-square values
| | Description | df1-df2 | chisq1-chisq2 | chi-diff(p=0.05) | Significant |
| | Model 1: msmt model | 19 | 16.340 | 22.362 | No | | Model 2: msmt model | 22 | 23.198 | 28.869 | No | | Model 3: msmt model | 25 | 22.191 | 30.144 | No | | Model 1: Model 2 | 3 | 6.858 | 11.071 | No | | Model 1: Model 3 | 6 | 5.851 | 12.592 | No | | Model 2: Model 3 | 3 | -1.007 | 3.841 | NA |
| |
| References | | AdamsD.A., NelsonR.R., ToddP.A.
(1992),
“Perceived usefulness, and usage of information technology: a replication”,
MIS Quarterly,
16(2),
227–247. TopBack | | BergeronF., RivardS., De SerreL.
(1990),
“Investigating the support role of the information center”,
MIS Quarterly,
14(3),
247–260. TopBack | | ChoeJ.
(1998),
“The effects of user participation on the design of accounting information systems”,
Information & Management,
34(3),
185–198. TopBack | | DavenportT. H.
(1998),
“Putting the enterprise into the enterprise system”,
Harvard Business Review,
76(4),
121–131. TopBack | | DavisF.D., BagozziR.P., WarshawP.R.
(1989),
“User acceptance of computer technology: a comparison of two theoretical models”,
Management Science,
35(8),
982–1003. TopBack | | DowningC. E.
(1999),
“System usage behavior as a proxy for user satisfaction: An empirical investigation”,
Information & Management,
35(4),
203–216. TopBack | | FishbeinM., AjzenI.
(1975),
Belief, Attitude, Intention and Behavior: An Introduction to Theory and Research,
Addison Wesley:
Boston, MA. TopBack | | GarrityE. J.
(1994),
“User participation, management support and system types”,
Information Resources Management Journal,
7(3),
34–43. TopBack | | GlorfeldK. D., CronanT. P.
(1993),
“Computer information satisfaction: A longitudinal study of computing systems and EUC in a public organization”,
Journal of End User Computing,
5(1),
27–36. TopBack | | HartwickJ., BarkiH.
(1994a),
“Explaining the role of user participation in information system use”,
Management Science,
40(4),
440–465. TopBack | | HartwickJ., BarkiH.
(1994b),
“Measuring user participation, user involvement, and user attitude”,
MIS Quarterly,
18(1),
59–82. TopBack | | HwangM. I., ThornR. G.
(1999),
“The effect of user engagement on system success: A meta-analytical integration of research findings”,
Information & Management,
35(4),
229–236. TopBack | | JacksonC.M., ChowS., LeitchR. A.
(1997),
“Toward an understanding of the behavioral intention to use an information system”,
Decision Sciences,
28(2),
357–389. TopBack | | JensonR. L., JohnsonI. R.
(1999),
“The enterprise resource planning system as a strategic solution”,
Information Strategy,
15(4),
28–33. TopBack | | LuH., WangJ.
(1997),
“The relationships between management styles, user participation, and system success over MIS growth stages”,
Information & Management,
32(4),
203–213. TopBack | | McKeenJ. D., GuimaraesT.
(1997),
“Successful strategies for user participation in systems development”,
Journal of Management Information Systems,
14(2),
133–150. TopBack | | MontazemiA.R., CameronD.A., GuptaK. M.
(1996),
“An empirical study of factors affecting software package selection”,
Journal of Management Information Systems,
13(1),
89–105. TopBack | | NewmanM., NobleF.
(1990),
“User involvement as an interaction process: A case study”,
Information Systems Research,
1(1),
89–113. TopBack | | RobeyD., FarrowD.
(1982),
“User involvement in information system development: A conflict model and empirical test”,
Management Science,
28(1),
73–85. TopBack | | TaitP., VesseyI.
(1988),
“The Effect of User Involvement on System Success”,
MIS Quarterly,
12(1),
91–108. TopBack | | TanB. W., LoT. W.
(1990),
“Validation of a User Satisfaction Instrument for Office Automation Success”,
Information & Management,
18(4),
203–208. TopBack | | YoonY., GuimaraesT.O., NealQ.
(1995),
“Exploring the factors associated with expert systems success”,
MIS Quarterly,
19(1),
83–106. TopBack | | ZimbardoP.G.
(1969),
“The human choice: Individuation, reason, and order versus deindividuation, impulse and chaos”. In
LevineW. Ed.,
Nebraska Symposium on Motivation. University of Nebraska,
Lincoln,
1969,
237–307. TopBack |
Appendix A Description of the Questionnaire ‘User Participation’ is composed of three constructs: Overall responsibility, User-IS Relationship and Hands on activity. ‘Overall responsibility’ is measured by six questions. The responses are measured on a nominal scale. For the analysis process averages of the response values on each scale are taken. The responses of the first five questions are averaged (Yes = 1 and No = 0) and response on the sixth question is used individually (each box in the question, if ticked, is assigned the value). ‘User-IS Relationship’ is measured using seven questions. All the responses were measured on a nominal scale. The average of the responses on each scale was taken for analysis. The responses on the first five questions are averaged to give value of the first manifest variable. The next two questions are averaged to arrive at the value of the second manifest variable measured User-IS relationship. ‘Hands-on-activity’ is measured using five questions scored on a nominal scale. Responses on all the five questions are averaged to arrive at a measure for this construct. Thus, hands-on-activity acts as a manifest structural variable in the TRA model (a construct being measured directly- using only one manifest variable). ‘User Involvement’ is measured on 9 dimensions. These are: Important/Unimportant, Needed/Not needed, Essential/Not essential, Trivial/Fundamental, Significant/Insignificant, Means a lot to me/Means nothing to me, Of concern/Of no concern, Relevant/Irrelevant and Matters to me/Does not matter to me. Each dimension is measured on a 7-point interval scale. The positive affects (useful, means a lot to me etc.) in each dimension is assigned a value +3 while the other extreme is assigned a value –3. Intervals are on increments of 1.0. Responses on all the 9 dimensions are averaged to arrive at a single measure of the manifest structural variable – User Involvement. ‘Attitude towards the system’ is measured on 4 dimensions using a 7-point interval scale. These are: Good/Bad, Terrific/Terrible, Useful/Useless and Valuable/Worthless. Responses are given numerical values similar to that in case of measurements for User Involvement. Attitude towards the system also acts as a manifest structural variable in the TRA model. The TRA constructs are measured based on frequency of system use and extent of system (whether system use is heavy or light). ‘Attitude concerning system use’ is measured on the same dimensions as in ‘Attitude towards the system’. Measurements are on a 7-point scale and measurements on frequent use of system and heavy usage of system are each averaged to yield measures of the two manifest variables. ‘Subjective norm concerning system use’ is measured using six questions. Responses are on the basis whether the responder's superiors, peers and subordinates expect him/her to frequently/heavily use the ERP system. Responses are taken on a 7-point scale with ‘should’ and ‘should not’ being the extremes. The extremes have been given values –3 (for should not) and +3 (for should). Intention to use the System and System usage (as reported by the respondent in the questionnaire) are measured on two dimensions. These are: ‘Heavy usage/Light usage’ and ‘Frequent usage/Infrequent usage’. Measurement is on a 7-point interval scale with one extreme given the score 0 and the other extreme 6. Appendix B Analyzing the Measurement Model In measurement model analysis, for each manifest variable, a loading factor is defined which indicates the extent to which it is influenced by the underlying construct (the construct with which the variable is associated with in the model). All the manifest variables are endogenous, and hence, an error term for each is defined. All latent constructs and error terms are treated as exogenous variables. Variances of error terms need to be estimated in the analysis while those of the latent constructs are fixed with value equal to 1.0. For structural manifest variables (“hands on activity”, “attitude towards the system” and “user involvement” in the present model being studied), variances are kept as unknowns which need to be estimated. All structural variables (latent and manifest constructs) are allowed to co-vary among one another. The measurement model is thus the least constrained model and has the least number of degrees of freedom. The measurement model was analyzed using the CALIS procedure in the SAS system. Assessing Overall Model Fit The goodness of fit indices used for analysis are presented below. The chi-square value for the measurement model is = 77.1885 which is significant at a p-value of 0.0387. The ratio of chi-square and the corresponding degrees of freedom is equal to (77.185/57) 1.354, which is less than 2.0 (which is one of the criteria of good fit between model and data). The other fit indices, comparative fit index (CFI by Bentler) and the non-normed fit index (NNFI), have values of 0.9415 and 0.8922 respectively. For a model with a good fit, CFI and NNFI should be close to 1.0 (generally a threshold of 0.85 or 0.9 is sufficient to assert a good fit of the model with the sample data). From these values, coupled with the chi-square/d.f. ratio, it can be said that a good fit exists between the sample data and the measurement model. Analyzing Significance of Factor Loadings and Convergent Validity All factor loading for the paths between manifest variables and the corresponding latent constructs are statistically significant at p=0.05 (the minimum t-value being equal to 4.7). None of the error estimates are very close to zero. Hence it can be said that all manifest variables are significant and have statistically significant loadings on the associated latent constructs. The significance of the paths also indicate convergent validity which refers to the extent to which manifest variables associated with a particular construct are strongly correlated with one another. Significance of the t-values for the loading coefficients also indicates convergent validity. Assessing Reliability and Validity of Constructs and Indicators Indicator reliability of the manifest variables is tested using squares of the standardized loading values. Indicator reliability indicates the percentage of variation in the manifest variable explained by the underlying construct. As seen in Table 2, low indicator reliability values are shown by the manifest variables V2 (0.4515), V4 (0.4621), V10 (0.4775) and V15 (0.5168). A similar observation was made when studying the R2 values for the manifest variables. The lowest amount of explained variance was found to be with V2, V4, V10 and V15 (R2 values of 0.451, 0.462, 0.47 and 0.51 respectively). All other variables have acceptable indicator reliability and R2 values.
Analyzing Composite Reliability and Variance Extracted Estimate In Table 3, the composite reliability (alpha) and the variance-extracted estimate for each latent construct is shown. Composite reliability is analogous to Cronbach alpha and reflects the internal consistency of the indicators (manifest variables) measuring a given factor. A value greater than 0.5 for variance extracted estimate and a value greater than 0.7 for composite reliability is considered acceptable. Hence, the variance-extracted estimates in the present measurement model are all acceptable.
Overall it can be said that the measurement model has an acceptable fit with the sample data. The manifest variables can be said to reliably measure the latent constructs they are associated within the TRA model. Since the model has been validated in other scenarios and seems to fit well in the present context no further modifications on the model are proposed. Overall goodness of fit indices are presented below. Table 4 contains indices used to check overall goodness of fit for the three models.
It can be seen that the indices show presence of a good fit with the sample data for all the three models. For all the three models chi-square/d.f. ratio is less than 2.0 (1.231, 1.271 and 1.216 for models 1, 2 and 3 respectively). CFI values are greater than 0.9 for all the three models, which is another indicator of good fit. NNFI values are also above 0.9 for all the three models. When compared with each other, the modified model of ERP use (Model 3) shows equally good index values while having the highest degrees of freedom. Analyzing the Loading Coefficients and Path Coefficients The loading coefficients for all the three models come out to be statistically significant. This is expected as the measurement model has shown a good fit with the sample data and all loading factors were significant in that case also. In addition, the loadings of the manifest variables on the latent constructs have been previously tested by Hartwick and Barki in the context of studying system usage and they have been found to be statistically valid. While analyzing the path coefficients the sign of the path co-efficient and its statistical significance is considered. As per the nature of the constructs and past studies using TRA, all the paths should have positive coefficients. It is desired that all paths should be statistically significant. It was observed that only in model 3 the path coefficients were non-negative. Except the path from “Subjective norm concerning use” to “system use” and the path from “overall responsibility” to “user involvement”, all other paths were significant at p=0.10. Removal of these paths affected model fit and made other path coefficients negative. Hence from a modeling standpoint as well as based on arguments made subsequently, it was felt that these paths, though non-significant, would exist in the ERP context. It was observed for all the three models that the differences between explained variances and actual variances were concentrated around the zero mark with few large residuals. On a comparative basis model 1 showed a higher spread of residuals than models 2 and 3. Residual plots of models 2 and 3 were comparable. On comparing the normalized residuals in cases of models 1 and 3, only the first two residuals were greater than 2.5 while for model 2 only the first residual was greater than 2.5. Residuals for model 2 were the least. For a good fit, normalized residuals should not be more than 2.5. The R2 values for the models showed that for some of the manifest variables, the explained variances by the underlying factors are low (though in the measurement model, the explained variances were acceptable). Also the explained variance of the construct subjective norm of use was very low in all the three cases. This indicates that ‘subjective norm of use’ is not affected by any of the constructs in the model. Checking for Chi-square Difference, Model Parsimony and Significance of the Structural Model Measures of model parsimony for the three models are presented in Table 5. When competing models explain nearly the same amount of variance in the sample data and show comparable fit (fits of the models are not significantly different), then the model with the least number of assumptions, which is the most parsimonious model in the set, is chosen. Parsimony ratio, as shown in the table below, is equal to the ratio between the degrees of freedom of the model of interest and the null model. The null model is a model that comprises the same variables and constructs but is devoid of any correlation or causal path. In other words, the null model is the most parsimonious model.
From Table 5 it can be seen that the third model is more parsimonious than the remaining two models (parsimony ratio = 0.724). The third model also has the maximum degree of freedom and a low Chi-square value. Hence as per parsimony considerations, Model 3 is more preferable to model 1 and model 2. A separate set of indices were calculated and studied to assess the goodness of fit for the structural portion of the model. The indices which were used are Relative normed fit index (RNFI), Relative parsimony ratio (RPR) and Relative parsimony normed fit index. The measures for the structural potion of the model for Models 1, 2 and 3 are shown in Table 6.
As per the values in the table model 3 has the highest values for all the three indices - relative parsimonious normed fit index, relative parsimony ratio and relative normed fit index. Hence, model 3 is more preferable to models 1 and 2. Analyzing the Models using the Chi-square Difference Test In addition to the above tests, a chi-square difference test was carried out to test the significance of the difference in chi-square values between two models with respect to the difference in their degrees of freedom. For the three models proposed, Table 7 shows the relevant values regarding the test.
It can be seen from the table above that the chi-square difference between the measurement model and all the other three models being tested is not significant at p=0.05 significance level. Thus both model 2 and model 3 satisfy the chi-square difference test criteria for an ideal model fit. The chi-square difference test of model 2 and model 3 are not carried as model 3 has the lower chi-square value as well as the higher degrees of freedom. Based upon the above tests and observations, the path configuration of model 3 (Figure 5) is proposed as the model explaining usage of ERP in the context of the theory of reasoned action. | |
|
|
|