Introduction Even though, chromosomes were first visualised and discovered by Waldeyer in 1888, interest in the study of human chromosomes was not evinced by cytologists till the last decade of the 19th century. Based on his study of spermatogenesis in testicular cells Thomas Painter (1923) reported 48 as the chromosome number for human species, Homo sapiens. This was taken as valid for subsequent three decades. The first accurate count of the full human chromosome complement was made by Tjio and Levan in 1956 as 46, which was confirmed independently by Ford and Hamerton (1956) and by several others subsequently. With the discovery of DNA as a genetic material and chromosomes as bearers of genes, this cytological structure became the focus of research, opening up a new area, the chromosomology. |
The chromosomes are work benches, constituting the genome complement of each living species, on which genes (DNA) are replicated and transcribed. During the mitotic division in somatic cells, the chromosomes go through a series of changes, divide and pass on genetic information to daughter cells with a great degree of fidelity. On the other hand, during gametogenesis germinal cells go through an elaborate process of meiosis, where the homologous chromosome pair cross-over to exchange the genetic material to provide opportunity for genetic recombination, followed by a series of equational and reductional division to form ultimately haploid gametes to ensure a constancy of chromosome number (genome content) for the species after fertilisation. Keeping in view the advancement of genetics and molecular biology, this review attempts to highlight different developments in the visualisation of human chromosomes and discusses medical applications of cytogenetics in the present genomic era. |
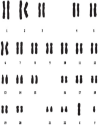
Top Early Discoveries of Pre-Banding Era Prior to 1970 most of the protocols to visualise chromosomes under light microscope relied on nucleoprotein stains like Giemsa to present uniformly stained chromosomes. The relative size differences and position of centromere enabled matching of 23 pairs of chromosomes from a single metaphase and classified them into seven basic groups (A-G) to construct a karyotype. The serendipitous discovery by Hsu (1979) that addition of water to a suspension of human mitotic cells prior to their fixation and dropping onto microscopic slides results in well spread out chromosomes, gave a further fillip to the field of chromosomology. According to Denver classification (1960), the human karyotype consists of 22 pairs of autosomes and 1 pair of sex chromosomes arranged into seven groups: 1–3, 4–5, 6–12 + X, 13–15, 16–18, 19–20 and 21–22 + Y. Females have two X chromosome, and males have one X and one Y chromosome (Figure 1). |
Soon physicians were attempting to correlate human disorders to changes in chromosome number and structural variations. One of the earliest demonstrations of human disorders attributed to abnormal chromosome number, trisomy 21, is Down syndrome (Lejeune et al., 1959). Soon after Edwards et al. (1960) reported trisomy for E group (chromosome 18) and Patau et al. (1960) reported trisomy for a D group (chromosome 13). Subsequently, a number of aberrations involving the sex chromosome were reported. Ford et al. (1959) reported that Turner syndrome was due to 45, XO condition. Similarly, Jacobs and Strong (1959) revealed that Klinefelter syndrome was due to 47, XXY condition; Jacobs et al. (1959) described super female syndrome as a consequent to 47, XXX condition. For the first time in 1960, the chromosomal structural aberration was implicated in cancer; a smaller than normal chromosome 22 was identified in neoplastic cells from patients with chronic myloid leukaemia (Nowell and Hungerford, 1960), which subsequently came to be known as Philadelphia Chromosome (Ph1). The standardisation of lymphocyte culture protocol by Moorhead et al. (1960), using phytohemagglutinin as a potent mitogen gave further impetus for the proliferation of Clinical Human Cytogenetics Laboratories all over the world. The work of Penrose and Delhanty (1961) on macerated fetus and Carr (1963) on aborted fetus showed that about 40% of these were chromosomally abnormal with trisomy as the most common disorder. Soon it became evident that various chromosomal abnormalities were responsible for congenital malformations, miscarriages and several syndromes (Table 1). Steele and Breg (1966) demonstrated that amniotic fluid cells can be cultured and karyotyped. |
As a result, prenatal screening of pregnancies with risk of chromosome abnormalities was started. The development of chromosome banding technology by Casperson et al. (1970) has revolutionised the whole field of clinical cytogenetics. It became soon possible to pinpoint the abnormalities associated with changes in number as well as position of chromosome segments and consequently a large number of prenatal diagnosis of cytogenetic disorders were made possible (Table 2). |
Top Heralding of Banding Era With an avalanche of data pouring in implicating the involvement of chromosomal anomalies in various human disorders including cancer, clinical cytogeneticists were looking for reliable methods of preparing karyotypes to visualise chromosomes to detect even subtle changes in their structure. The development of banding techniques in the early 1970s (Casperson et al., 1970) enabled clinical geneticists in matching and identifying each chromosome pair in a karyotype thus paving the way for accurate cytogenetic diagnostics of disorders and diseases in human beings. The innovations in staining methods made possible to subdivide chromosome regions into discrete bands in each arm, with its characteristic location, size and intensity. Hundreds of chromosome bands have been recognised and counted for each haploid set of chromosomes. The banding techniques enabled detection of subtle structural abnormalities and identification of specific chromosomes involved in aberrations like aneuploid conditions. Furthermore, the bands also served as useful landmarks in mapping of genes to specific chromosome loci. Some of the common methods that helped in perceiving banded chromosome are: Q-banding, G-banding, C-banding, NOR-banding, Replication banding, Reverse banding and T-banding (Table 3). |
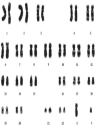
Quinarcine Banding (Q-banding) Q-banding method was one of the first chromosome band visualisation technique discovered in by Casperson et al. (1970). When chromosomes are stained with certain flurochrome substances like quinacrine mustard or quinacrine dihydrochloride and examined with fluorescence microscopy, a pattern of alternating bright and dull bands called as Q-bands, manifest all along each chromosome with varying intensity. The basis for such bands is due to differential degree of interaction of flurochrome dyes. The brighter bands are due to excessive binding of the pigment to the AT-rich region and the dull bands are due to lesser affinity to bind in the GC-rich region. Since AT and GC base pairs are unequally distributed throughout each chromosome, the brocade like banding pattern is formed depending on the dispersion of AT and GC-rich regions. The brighter (AT-rich region) constitute heterochromatin region and the dull bands are due to euchromatin (GC-rich region) wherein most of the functional genes lie. These give distinct landmarks whereby any numerical or structural chromosome aberration can be confirmed unambiguously. One unique utility, of this technique is that of all the chromosomes, the ‘Y’-chromosome can be easily identified since the distal portion ‘q’ arm of ‘Y’-chromosome fluoresces very brightly. In fact, the Yq band is highly polymorphic and in about 2% of the male population this band is absent; probably this region might not contain clinically important genes. Various polymorphisms involving satellites and centromeres of specific chromosomes can also be studied by this banding technique. Giemsa Banding (G-banding) The G-banding technique introduced in early 1970s, is one of the most widely used chromosome staining procedures. It involves treating the chromosomes with trypsin and staining with Giemsa solution (Seabright, 1971). An array of alternating light and dark bands, similar to those of Q-bands, along each chromosome are formed which are identical in homologous chromosomes. This uniqueness makes the technique very useful in identifying and pairing each of the chromosomes precisely (Figure 2). Furthermore the G-banding pattern is not only permanent but also is distinctly clear, easy to photograph and can be visualised with an ordinary light microscope. The mechanism of banding pattern essentially relates to the chromosome structural organisation. The treatment of chromosome with trypsin probably results in unequal removal of nucleoprotein in chromosomes from GC-rich hetero- and AT-rich euchromatin regions. This differential alteration occurs all along the chromosome and leads to the formation of dark AT-rich bands and lighter GC-rich bands. However, the number of bands formed per genome depends upon the stage at which the bands are scored. Fewer number of bands, approximately 400 are formed in haploid genome during mid-metaphase stage, where the chromosomes are highly condensed. In prophase and early metaphase, where the chromosomes are relaxed, more than 850 bands/haploid genomes have been reported (Yunis, 1976). For routine analysis, Giemsa banding became the most accepted worldwide. This technique enabled the detection of various structural aberrations like translocation, inversions, deletions and duplications in addition to well known numerical aberrations like Down syndrome and Turner syndrome. Centromeric Region Banding (C-banding) It was first reported in 1970 by Pardue and Gall. They discovered that the centromeric region of mouse chromosome stains dark with Giemsa since that region is replete with repetitive DNA sequences. The same kind of banding pattern was reported by Arrighi et al. (1971) particularly in distal parts of Y and in q-arms and pericentromeric regions of human chromosomes. The basis for this kind of staining and banding pattern is due to differential extraction of DNA in different regions of chromosomes; less DNA being extracted in C-band region as compared to that of non-C-band regions (Comings et al., 1973). Though there are diverse methods to produce C-banding, the most commonly used protocol is treating the chromosome preparations with Hydrochloric acid (HCl), Barium hydroxide Ba(OH)2, Salt solution (NaCl) at elevated temperature and staining with Giemsa subsequently. Another protocol which involves staining with fluorochrome dyes such as distamycin A or 4, 6-diamino-2-phenylindole dihydrochloride, is also available. Many chromosomes are polymorphic for C-banding in human population and may not have any clinical importance but can be visualised optimally with C-banding method. This approach resolves most often acrocentric chromosomes, the centromeric regions of chromosome 1, 9 and 16, and distal portion of the Y chromosome. This method is particularly useful in identifying the chromosomes with multiple centromeres and also to study the genesis of diploid molar pregnancies and genuine hermaphroditism. It also has utility in distinguishing the donor and recipient cells during bone marrow transplantation. Nucleolar Organising Region (NOR – banding) Nucleolar organisation region is confined to a specific chromosome in plants as well as in animals, and the involved region is termed as Nucleolar organising Region (NOR). This region is often located in the satellite stalks of acrocentric chromosomes. It is important because many genes that govern the ribosomes and protein synthesis, are located in this region. Matsui and Sasaki (1973) for the first time developed a protocol for resolving NORs in human chromosomes. Subsequently, Goodpasture et al. (1975, 1976) presented a facile and simple technique of staining the chromosomes with silver nitrate (AgNO3); this protocol presently is in vogue. The basis for observed bands is due to interaction of structural proteins (histones) that exist in NOR region with silver nitrate giving distinctive band appearance. It may be noted that all satellite tails or stalks are not always stained positively. The clinical importance of unstained structurally normal acrocentric chromosome is not known. However, NOR-banding is useful in clinical medicine especially to study certain type of chromosomal polymorphism like double satellites and also in identification of satellite stalks on non-acrocentric chromosomes. Replication Banding (R-banding) Lionisation is a process that inactivates one of X-chromosome in females to maintain parity of gene dose in both genders and ensures that no gender bias exists for the gene content. Cells need only one functional X-chromosome. Any redundant ones get inactivated during early developmental stages of embryo and lag behind in replication till subsequent cell divisions. Consequently, the late replicating chromosome gets highly condensed and appears as a condensed chromatin structure appended to the nuclear membrane. Latt (1974, 1975) provided a method to identify late replicating X-chromosomes during metaphase. Hence the popular name, R-banding or RBA. In his protocol 5-Bromo uridine (Brdu) is used 3–12 hrs prior to termination of the culture in which cells are allowed to undergo two cycles of replication. After that acridine orange is used for staining, late replicating X-chromosome as well as late replicating regions on all chromosomes pick up dark stain. The result is a reverse banding pattern as compared to G-banding. Giemsa Reverse Banding (RHG) Reverse banding using heat and Giemsa (RHG) was described by Dutrillaux and Lejeune (1971). This technique involves the incubation of slides in hot phospate bufer with subsequent Giemsa staining. The resulting chromosome pattern shows darkly stained R bands and pale G bands. R bands are GC-rich regions which remain intact, whereas the AT-rich regions which are light stained, are selectively, or more readily, denatured by heat. This is consistent with the fact that GC-specific fluorochromes also produce a reverse chromosome banding pattern. In many laboratories, RHG methods have been abandoned in favour of a fluorescent R-banding technique (Gustashaw, 1991). R-banding methods are useful for analysing deletions or translocations that involve the telomeres of chromosomes. T-Banding The T-banding is used to stain the telomeric regions of chromosomes. This technique was developed by Dutrillaux (1973), who used two types of controlled thermal denaturations followed by staining with either Giemsa or acridine orange. The T bands apparently represent a subset of the R bands because they are smaller than the corresponding R bands and are more strictly telomeric (Gustashaw, 1991). Top Heralding of Molecular-Cytogenetic Era By the end of the first half of 20th century it was well established that DNA is the genetic material universally barring few exceptions like some viral genomes where the genetic material is RNA. The double helical structure was proposed for DNA by Watson and Crick (1953) that explained the two fundamental properties of life, namely duplication (replication) and the sources of biological diversity (mutation) including information storage, retrieval and transfer to the progeny cells as well as organisms. This initiated an avalanche of research which lead to not only most of the fundamental discoveries of molecular biology, but also several new areas of life sciences including developmental biology, molecular medicine and structural biology. After the demonstration of organisation of DNA in chromosomes and the mode of duplication was made by autoradiography using tritium-labelled thymidine by Taylor et al. (1957), the search for novel and special techniques for visualising chromosome ensued leading to the foundation of Molecular-Cytogenetics. |
Top Special Methods for Resolving Finer Structure of Chromosomes Sister Chromatid Exchanges (SCEs) Replication kinetics of DNA was studied by Latt (1974) using microfluorometric methods, which helped in analysing the inter chromatid exchanges in human chromosomes. Kato (1977) demonstrated the spontaneous sister chromatid exchanges following the BudR-labelling method. Soon Korenberg and Freedlander (1974) developed Giemsa technique for the detection of sister chromatid exchanges. All these techniques enabled the observation of exchange of genetic material between sister chromatids. Although biological significance of SCEs is not clear, it has been increasingly used in genotoxic studies (Wolff et al., 1977, Carrano et al., 1978) owing to their enhanced frequency on treating with mutagens and carcinogens (Perry and Evans, 1975). The SCE studies might be useful in detecting genetic disorders like Bloom syndrome as the SCE frequency is accentuated significantly in the syndrome when compared to normal individuals. An increase of SCEs is noted in patients with ankylosing spondylitis (Sonmez et al., 1997), in smokers (Lambert et al., 1982), in patients with carcinoma of the cervix and uteri (Sungu et al., 2001). Essentially the SCEs are the mitotic events unlike crossing over that occurs in the germ line. Sister chromatid exchanges present themselves as interchanges between sister chromatids of bright and dul fluorescent segments when cells cultured by incorporating Brdu in place of thymidine into replicating cells for two consecutive cycles. On account of semi conservative mode of replication of DNA in chromosomes, they have two types of chromosomes one with Brdu incorporated into one of the chromatid and the other has Brdu incorporated in both the chromatids. On staining with a fluorescent dye like acridine the fluorescence appears differentially. One of the chromatids appears more brightly than the other chromatid thus making it possible to visualise the SCEs. Constitutive Fragile Sites and Chromosome Breakage In human chromosome analysis, certain gaps representing uncondensed chromatin (DNA) were seen consistently at the same sites (loci). These are called fragile sites. These can also be induced by altering the culture media composition that causes perturbation in DNA replication. The fragile sites thus caused can be best resolved in chromosomes by staining it with conventional banding or non-banding protocols. Even though fragile sites may be present in healthy humans to a certain extent, they assume clinical significance since their high frequency is associated with certain disorders like fragile X-syndrome (Xq27.3), Faconi anaemia and cancer (Lubs, 1969, Sutherland 1979, Auerbach et al., 1981). Somatic Cell Hybrids and Cytogenetic Analysis With the ushering in of somatic hybridisation, the human Cytogenetic analysis has taken a new turn and attained momentum in the genetic analysis of homology and evolutionary interrelationships of diverse genes and chromosomes. Ruddle et al. (1971) provided syntenic relationship of several gene loci by somatic cell hybridisation between man and mouse and by comparing hybrids of man–mouse somatic cells. The underlying approach was very simple but elegant. When somatic cells of two species were fused, the resultant hybrid cell in its course of further division to proliferate, there is a tendency to lose the chromosome number of one of the species progressively. The resultant lines can be irradiated and cell lines can be selected having single or part of a chromosome of one species retained along with the genome complement of another species. This way the gene marker of interest can be detected and established by cytogenetic analysis. Novel Complementary Technique of Molecular Cytogenetics Conventional cytogenetic analyses are limited in their utility for clinical and for diagnostic purposes since they require dividing cells to observe the chromosomes. There is also a limitation of the resolution that can be achieved by the conventional cytogenetic studies. The resolution of variation in chromosomes that can be possibly realised by light microscopy would be around 4mb in size. The maximum resolution depends on the quality of preparations. Small deletions or duplications are impossible to see through light microscopy. The problem also arises in the case of rearrangements particularly with the small chromosomes even though G-banding pattern permits the identification of rearranged segments. Over the years diverse complementary techniques have been developed to have a more clear identification of chromosomal aberrations of clinical importance that otherwise can not be achieved using conventional cytogenetic analysis. Flow cytometry, originally developed for cell sorting and chromosome separation (Carrano et al., 1979) assumed importance in characterisation of chromosome specific genomic libraries of the human genome (Krumlauf et al., 1982). Top Fluorescent in situ Hybridization (Fish) Fluorescent in situ hybridisation (FISH) is a technique that uses molecular DNA probes to detect complementary DNA sequences along the chromosomes. It has become an invaluable tool in the diagnostics as well as clinical laboratories doing research in molecular cytogenetics and medicine. The main advantage of this technique is that it permits the location of specific cloned DNA sequences on the chromosomes both on dividing cells (metaphase) and resting cells (interphase nucleus). |
A single stranded probe DNA is permitted to anneal (hybridise) to the single stranded target DNA (which is still in natural position on the chromosome) In Situ. The probe is coupled to a fluorochrome, a dye which fluoresces when it is excited with a specific wave length of light and is visualised under a fluorescent microscope. Several different probes can be hybridised, observed and compared simultaneously by using different colours and combination of fluorochromes for each probe. The elegance of the FISH technique is that it allows the simultaneous assessment of molecular and cytogenetic information on metaphase chromosome preparations as well as interphase cells; Landegent et al. (1985) were one of the pioneers to localise a single copy human gene, thyroglobulin by this technique. |
FISH can be used to analyse numerical and structural abnormalities even if the abnormality involves a very minute segment of the chromosome. The most common applications include the characterisation of numerical abnormalities and the detection of micro deletions, duplications and structural rearrangements that are beyond the resolution of light microscopy. FISH has been used in anaplastic large cell lymphoma, Acute Myeloid Leukaemia (AML) patients with trisomy 8 (Dodge et al., 2004) and for analysing chromosomal abnormalities of tumor in children (Raimondi, 2000). |
FISH has paved the way for a more powerful technology called as spectral karyotyping (SKY) or multicolour FISH (M-FISH). The main application for M-FISH has been in solid tumors, which are often characterised by complex karyotypes, in AML and acute lymphoplastic leukaemia (Kearney, 2006). |
Top Genomics: Molecular Location of Genes on Chromosomes by Comparative Genomic Hybridization The major land mark and turning point in life sciences in general and in the field of cytogenetics in particular, is the establishment of genomics. Undoubtedly, it became one of the promising and distinct fields of research. Subsequent developments in other “omics” such as, proteomics, transcriptomics, glycomics, pharmacogenomics and functional genomics have also been established. The development of sequencer (Hunkapiller et al., 1991) and rapid sequencing of genome by Expressed Sequence Tags suggested by Craig Venter (Adams et al., 1993) resulted in advancement of Human genome project and the field of molecular cytogenetics gained impetus and its impact was felt all around. Kallioniemi et al. (1992) studied the comparative genomic hybridisation for the molecular cytogenetic analysis of solid tumors. The technique developed was most elegant and simple. The genomic DNA of test and reference sample is isolated, fragmented, and loaded with different kinds of fluorescent dyes that glow red and green respectively and allow it to compete for hybridisation on normal metaphase chromosomes. With the help of computer programme (software tools) the proportion of red to green fluorescence is assayed along the length of each chromosome. The region with a ratio of one appear as orange, but those amplified in a test sample appear more red and have a ratio of more than one. Whereas those detected in test sample appear more green and have a ratio less than one. It became obvious that the comparative genomic hybridisation technique can detect deletions and duplications in the range of 3–5 Mb. This technique provides a powerful and sensitive method for the whole chromosome aneuploidy, as well as duplication, and deletions of significant size (Wells et al., 2003). |
CGH is a molecular cytogenetic method of screening a tumor for genetic changes. The alterations are classified as DNA gains and losses and reveal a characteristic pattern that includes mutations at chromosomal and subchromosomal levels. CGH serves as an important global screening test for chromosomal aberrations present within a tumor genome. Most importantly, tumor DNA extracted from archived, formalin fixed, paraffin–embedded tissue can be used (Spelcher et al., 1993). |
Although CGH is a powerful molecular cytogenetic method for the screening of a tumor genome for chromosomal imbalances, it has some methodological limitations, for example CGH does not detect balanced chromosomal translocations or inversion. In addition, it is particularly difficult to analyse small interstitial deletions by CGH. Therefore, now a related molecular genetic method is used for the confirmation of DNA loss, that is the assessment of loss of heterozygosity (LOH). |
With the completion of the Human Genome project in 2003, the sequence of base pairs of each human chromosome is now available in public domain. This information allows researchers to provide a more specific address than the cytogenetic location for many genes like, DMD (Ronald 1987), CFTR (Drumm et al., 1990) or APOE (Strittmatter et al., 1993). A gene's molecular address pin points its location in terms of sequence of base pairs. For instance, the molecular location of the APOE gene on chromosome 19 begins with base pair 50, 100, 901 and terminates with base pair 50, 104, 488. This range indicates the precise size of the gene, which is 3588 base pairs. This knowledge also permits the researcher to determine exactly how far the gene is from other genes on the same chromosome. |
Top Microarray Technology for the Study of Gene Expression Though every cell in every tissue of the human body carries the total genome in its chromosomal complement, gene expression is always selective and is differential in time and space, exigencies of growth, development and challenges imposed by the environment. All the genes do not express themselves in every tissue at the same time and also do not respond identically. There is a differential response to varied environmental conditions. Till early 1990s the researchers were able to evaluate the expression of one gene at a time and compare with the data base. With the development of microarray (gene chip) technology it has become possible to study the expression of thousands of genes simultaneously (Schena et al., 1995). Gene chips are made with the help of robotics; probes up to fifty thousand known and unknown genes have been accommodated on a microchip. RNA extracted from the test sample is converted into cDNA and located with a fluorescent dye. The labeled cDNA is allowed to hybridise on the gene chip. Using software tools, the gene expression can be assayed qualitatively as well as quantitatively. Microarrays have been increasingly used in cancer studies. Besides, the microarray technology finds many applications in diverse fields of research like developmental biology, genetic toxicology, (toxicogenomics), proteomics, biotechnology, comparative genomics and personalised medicine. It enhances our understanding of the process of disease progression and regression as well as interaction of genes and environment. |
Top Future Scenario of Cytogenetics: Where Are We Heading? Cytogenetic research vis a vis the role of chromosomes in health and disease has come of age. All the epochal discoveries starting from ingenius DNA model of Watson and Crick to the complete development of Molecular biology and ultimately the establishment of complete human genome sequence and the field of genomics, has undoubtedly made us to understand clearly the role of genes in all aspects of life processes. Chromosomes are not just morphological entities carrying the genes from cell to cell and/or from generation to generation, exclusively needed, and studied microscopically for diagnostic purposes and analyzable during the cell cycle at the pro-metaphase. Nature has designed the chromosome as dynamic structures undergoing molecular changes as well as physical three dimensional conformational changes whose complexity is slowly being dawned. These changes are essential perquisites in gene regulation. All the physics of plasticity in relation to three dimensional positions of genes, which affect cell function during cell cycle, growth, development and differentiation needed to be understood in greater detail. It should address the problem of species’ specific differences in the chromosomal architecture besides addressing the problems of chromatin mediated alterations in the architecture of chromosomes or regions that may influence longevity of cells, tissues, organs and organisms. It should also address the prevalence of chromosome gaps and breaks. That means we are on the brink of unfolding another area of research namely Chromosomes. |
Top Figures | Figure 1:: Normal Male Karyotype (Giemsa Stained)
|  | |
| | Figure 2:: G-Banded Normal Male Karyotype
|  | |
|
Tables | Table 1:: Common chromosomal disorders and their incidence among newborns
| | Disorder | Birth frequency | | Trisomy 21 | 1 in 700 | | Trisomy 18 | 1 in 3000 | | Trisomy 13 | 1 in 5000 | | 47, XXY | 1 in 1000 males | | 47, XYY | 1 in 1000 males | | 47, XXX | 1 in 1000 females | | 45, X | 1 in 5000 females | | Balanced translocation | 1 in 500 | | Unbalanced translocation | 1 in 2000 | | Pericentric inversion | 1 in 100 |
| | | Table 2:: Characteristics of sex chromosome disorders
| | Chromosomal constitution | Disorder | Characteristics | | XO (no Y chromosome only one X chromosome) | Turner Syndrome | Female external genitalia, lacking ovaries, lack of secondary sexual characters, lack of menstruation, stunted growth. | | XXY | Klienefelter Syndrome | Male genitalia with female secondary sexual characteristics, enlarged breast, penis, scrotum and testes are small; sterile. | | XO/XY | Mixed Gonadal Dysgenesis | Male or female genitals or combination of both. No other abnormalities are associated, sometimes short stature. | | XXX | Triple-X Syndrome | Appear normal female, sometimes infertile, impairment of intelligence. | | XX/XY | True Hermophrodite | Variable features, associated with ovarian and testicular tissues, ambiguous external genitalia | | XYY | Supernumerary Y Syndrome | Normal male with tall stature, lack of control over impulsive behaviour |
| | | Table 3:: Banding techniques and Molecular mapping - A date line
| | Banding techniques and Molecular mapping | Investigator | Year | | Q-banding | Caspersson, Zech, Johansson | 1970 | | G-banding (by trypsin) | Seabright | 1971 | | G-banding (by acetic-saline) | Sumner, Evans, Buckland | 1971 | | C-banding | Arrighi, Hsu | 1971 | | R-banding (by heat and Giemsa) | Dutrillaux, Lejeune | 1971 | | G-11 stain | Bobrow, Madan, Pearson | 1972 | | Antibody bands | Dev et al. | 1972 | | R-banding (by fluorescence) | Bobrow, Madan | 1973 | | In vitro bands (by actinomycin D) | Shafer | 1973 | | T-banding | Dutrillaux | 1973 | | Replication banding | Latt | 1973 | | Silver (NOR) stain | Howell, Denton, Diamond | 1973 | | High resolution banding | Yunis | 1975 | | DAPI/distamycin A stain | Schweizer, Ambros, Andrle | 1978 | | Restriction endonuclease banding | Sahasrabuddhe, Pathak, Hsu | 1978 | | PCR was developed | Karry Mullis | 1986 | | Automated sequencer developed | Leroy Hood | 1986 | | DMD gene on chromosome X | Ronald Worton, Lou Kunkel | 1987 | | CFTR gene on chromosome 7 | Francis Collins, Lapchee tsui | 1989 | | Human sequencing by ESTs | Craig Venter | 1991 | | APOE gene on chromosome 19 | Allen Rose | 1993 | | DNA microarray developed | Pat Brown | 1999 | | Human chromosome 22 sequenced | Human Genome Project | 1999 | | Human genome draft sequence | Human Genome Project | 2000 | | Human chromosome 20 sequenced | Human Genome Project | 2001 | | Mouse genome draft sequence | Mouse genome sequence consortium | 2002 | | Human chromosome Y,6,7,14 sequenced | Human Genome Project | 2003 | | Human chromosome 5,9,10,13,16,18,19 sequenced | Human Genome Project | 2004 | | Human chromosome X,2,4 sequenced | Human Genome Project | 2005 | | Human chromosome 1,3,8,11,12,15,17 sequenced | Human Genome Project | 2006 |
| |
|