|
|
|
|
Impact of Training on Quality Management System-Case Study of A Tyre Manufacturing Company Routray Padmalita Dr.*,*, Mangaraj Sujata Prof.**,** *Lecturer,Departmentof Business Management, Fakir Mohan University,Balasore-756019 **Dean, MBA, Regional College of Management, Bhubaneswar-751023 *, Email: proutray2007@rediffmad com
**E-mail id: drsujatamangaraj@yahoo.com
Training employees in quality concepts and tools increases the effectiveness of quality improvement activities which is further strengthened through employee involvement. Sustaining and competing in tyre manufacturing industry requires achieving quality standards as per the customer specification. Application of quality control techniques requires knowledge and training. Sufficient exposure to quality concepts and technical abilities make the quality system effective. The company under study entered the Indian tyre market in 1991. In ten years of operation, it has scaled new heights of productivity. The continuous Quest for excellence saw the Company team add many feathers to its cap. It has received ISO 9001, ISO 14000 and QS 9000 certification. It is the only tyre plant in India to be ISO 9001, QS 9000, ISO 14001,SA-8000 certified along with having bagged the TPM Excellence Award. The first part of the study examines the existing HR practices particularly related to training in strengthening the quality management system in the organization. Second part of the study highlights the impact of training on quality management system Last part of the study concentrates on results of primary data survey in ascertaining training effectiveness in implementing quality management system. Supportive HR practices and well designed training system strengthen the quality system, which is found from the study. Top | Introduction Quality has been a central theme in HRM in which product/service quality is widely seen as an important way of improving organizational performance by attracting and retaining customers (Lee Cooke, 2000).Sustaining and competing in tyre manufacturing industry requires achieving quality standards as per the customer specification. Application of quality control techniques requires knowledge and training. Sufficient exposure to quality concepts and technical abilities make the quality system effective. The training does not only give important information and knowledge to workers but also build confidence and acceptance from them (Judi et al 2009). The integrity of the quality management system is maintained when changes to quality management system are planned and implemented. Complying with the requirements of quality system and continually improving the effectiveness of the quality management system needs assurance that employees are appropriately trained. Training employees in quality concepts and tools increases the effectiveness of quality improvement activities through more employee involvement. In other words, training contributes to successful implementation of quality management systems in a firm |
Top Literature Review Training employees in quality concepts and tools increases the effectiveness of quality improvement activities which is further strengthened through employee involvement. Saraph et al. (1989) identified eight critical factors of quality management of which employee training and employee involvement were two factors. Bartel(1994) has explained the role of training in making growth in labour productivity. Similarly Russel/Terborg and Powers(1995) have shown a strong positive relation between percentage of trained employees and performance of the organization. Masters (1996) found absence of continuous training and education leading to ineffective TQM implementation. Likewise, Adebanjo & Kehoe (1998), who studied TQM implementation in UK manufacturing organizations, identified one of the quality problems as:
Upper management does not insist on systematic measuring of customer satisfaction level and training programs. Lack of training programs to enhance workers’ skills and involvement in quality improvement activities.
|
Pfeffer(1998) also considers training to be one of the characteristic dimensions of organizations that produce profits through people, not only because it is a way of developing skills but also because of the positive attitude it elicits in individual employees. Tamimi & Sebastianelli (1998) in their study found several factors working against TQM implementation. One of the barriers cited by samples included lack of training in areas such as group discussions, communication techniques, quality improvement skills, problem identification and problem solving techniques. Rao et al. (1999) pointed out that training is a pre-requisite to achieve world class manufacturing status. Salegna & Fazel(2000) identified human resource issues as the single most significant contributor in assuring effective TQM implementation. Another factor found to impede successful TQM implementation is that of training. When a strategic approach is taken to manage continuous improvement by including the human resource function, the alignment of learning and strategy pay off for the firm. Hyland, Milia, & Becker (2005) conducted an international survey on continuous improvement with 580 sample manufacturing organisations in Europe, South East Asia and Australia. The data reported in the survey highlighted that the learning behaviours are more evident in firms involving HR professionals than in firms not involving the HR professionals. |
Top Methodology The study investigates the extent to which
implementation of Quality Management System has improved organisation's performance training practices has strengthened the quality system there is effectiveness of Quality awareness programme. training has created satisfaction in members using and implementing Quality Management System
|
The first part of the study examines the existing HR practices particularly related to training in strengthening the quality management system in the organization. Second part of the study highlights the impact of training on quality management system Last part of the study concentrates on results of primary data survey in ascertaining training effectiveness in implementing quality management system. A structured questionnaire designed on basis of extensive literature review was administered to the respondents covering 10 managers, 15 officers, 22 supervisors and 40 workmen. Employees were asked for their opinions about training's objective, processes, nature, effectiveness and utility of the training they are receiving for strengthening quality system. |
Top Company Overview The company under study entered the Indian tyre market in 1991. In ten years of operation, it has scaled new heights of productivity. The continuous quest for excellence saw the Company team add many feathers to its cap. It has received ISO 9001, ISO 14000 and QS 9000 certification. It is the only tyre plant in India to be ISO 9001, QS 9000, ISO 14001,SA-8000 certified along with having bagged the TPM Excellence Award-lst Category form Japan Institute |
Top Quality Management System in the Company The company has established and documented its quality system in accordance with ISO/TS16949: 2002. Based on the "Quality Policy" Quality Objectives have been established, including those needed to meet requirements for product at the company level and relevant functions level. Departmental Quality objectives are linked to overall quality objectives of the company. These objectives are measured and reported against target/goals as specified in table: 1 |
Top Role of Training in implementing quality Management System The company believes that training is the key instrument of development and transformation of any organisation and crediting that by use of appropriate training practices, optimal results can achieved through enriching the employees by developing their skill & knowledge. Trends and results of last seven years as shown in table 2 are the good indicators that training is playing key role towards transformation & development of organisation.In table3 specific information on quality related training programmes conducted are given |
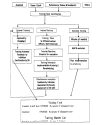
In the organisation training activities are being co-ordinated and monitored by HRD department through automated training management system as per Quality Management System requirements. In the organization the Head (Personnel and Administration) is responsible for implementation and propagation of quality system, quality policy and objectives. He is also responsible for identification of training needs of personnel and organising training for such identified needs. All personnel of the company who are engaged in work affecting quality of product are having appropriate education, skills and experience. They are also trained as per identified training need. Procedure is established and maintained for identification of the competence of personnel performing work affecting product quality. The following activities are undertaken by the organization to implement training programmes. The training flow chart is given in figure 1. |
Top Competency skill matrix Department wise competency of each and every employee is been measured on the basis of qualification and competence regarding job knowledge and skill. |
Top Identification of Training needs Training needs are identified through performance appraisal system, organisational training roadmaps, individual career progression plan as well different loss based analysis. Performance appraisal system is functioning through various appraisal methods like performance planning review and development method for senior executives on quarterly basis. Performance appraisal for all the staff & officers in 14 potentials are done on half yearly basis and workmen are being appraised on daily basis through target achievement and positive attitude practices. Appraisal analysis conclusions are categorized in terms of educational, motivational, communicational, developmental categories and in respect of organisational, departmental and individual training needs. Accordingly suitable module are being explored & shaped in annual training calendar. Organisational goals are broken into strategic business and in turn these are set as the various respective departmental target as well individual targets are percolated. To achieve these performance targets as potential bridging instrument different discipline wise training road maps are prepared as base source for training need identification. Individual career progression plan is ensured according the career self reliance practices under this career path for every employee has established and career planning has been open for everyone with required potential and necessary aligned experiences. Individual employee along with his mentor through various exercises necessary gap as well strength & weakness and required initiatives between existing & desired position has chalked out and accordingly training modules opted. Apart from these sources, various losses based training needs are being identified according occurrences of various quality, equipment and phenomena related losses. Different feedback and recommendations of various are also being considered to identify the training needs. These training needs are being identified through form. All these identified training needs are taken shape in training calendar according to the suitability of impartment for trainer, trainee and organisational working schedule. |
Re-training and horizontal training are the key feature of Quality Management system |
Top Participants in training At Birla Tyres each and every employee from CEO to workman are part of the training program, they may mentioned in following categories of employees for training activities in the company; |
Top Training infrastructure Birla Tyres have maintained three well quipped training room with capacity of each with 80 employees. Which equipped with ultra modern training accessories like direct data projector, LCD projector, slide projector, high power overhead projector, magnetic screens and computer simulation etc. |
Birla Tyres is maintaining a excellent practice training centre which equipped with practice training providing systems. One point lesson sheets, slide stands, basic and advance courses along with various miniature model on Machines. |
Top Training plan implementation Towards impartment of the training programs, the following three basic approaches has undertaken. |
For different selective topics they have engaged the premier national and international training organisation like CII, NPC, JIPM, IRQS, DNV, Quality growth service etc. |
Top Training plans After identification of different training needs and the implementation suitability of various training modules combined training plans are prepared for the different categories. |
Top Evaluation of effectiveness At Birla Tyres effectiveness of each & every training is evaluated with its contributions towards planned objectives and competency development. Evaluations of effectiveness are being assessed on 4 steps Kirk Patrick Pattern. (Reaction, Learning, Transfer, Performance). At the time of finalization of the training plan and training modules the criteria of evaluation of training are always being chalked out in a specific format. |
Top Impact of Training on Quality Management system The organization performance has improved significantly after implementing quality system by proper orientation and training of people on such system as evident from table 4 |
Top Employee Opinion Survey for ascertaining effectiveness of training in implementing quality Management System In order to assess the effectiveness of training system for successfully implementing the quality system a questionnaire was administered to 87 employees consisting of 10 managers, 15 officers, 22 supervisors and 40 workers and the responses are analysed and tabulated in table5.Besides,questions are put to respondents to ascertain the HR practices supporting the quality management system shown in table 6. |
Top Findings and Conclusion In the organisation training activities are being co-ordinated and monitored by HRD department through automated training management system as per Quality Management System requirements..The number of employees attending the training has increased and the man-hours spent on training has also increased over the years (Table2).from table 3 it is evident that the number of people trained has increased from 413 in 2005 to 557 in 2009.The man-hours spent has increased from 360 in 2005 to 1080 in 2009.This indicates that the duration of training programme has increased. The cost incurred on the quality based training programme has increased from a meager 3.6 lakhs in 2005 to 21.6 lakhs in the year 2009.From table 4 it is evident that continuous improvement programmes are part and parcel of the organizational life which is evident from the fact that 557 Kaizen topics are covered by end of 2009.Scarp generation, power consumption and fuel consumption have reduced. The satisfaction level of customers has increased considerably. Efficiency over the year has reached 98.72 percent (By end of 2009).From the primary data it is found that employees irrespective of their levels recognize training as a tool for increasing quality awareness and standards. During training need identification needs of quality management system is given due importance by the organization. However, the workers felt the desire for improvement I the process of training need identification. Employees particularly the workers felt the need for improvement in methods adopted for training. From the study it is found that certain HR practices like problem solving workgroups, self managed work team and group incentives are well prevalent in the organization.However, individual incentives and profit sharing are not well prevalent in the organization. |
Supportive HR practices and well designed training system strengthen the quality system, which is found from the study. This fact is also well supported by the literature review. Periodic survey on employee attitudes and creating a culture of continuous training and development can further strengthen the quality management system |
Top Figure | Figure: 1: Training Process Flow Chart
|  | |
|
Tables | Table:1: Performance Indicators
| | SL.NO. | PARTICULARS | TARGET | | A. | MANAGEMENT INDICATORS | | | 01. | Operating Profit | 96 Rs. Million/Month | | 02 | OEE Truck Tyre Curing | >95Δ | | OEE Passenger Tyre Curing | >90Δ | | OEE Tube Curing | >85Δ | | OEE NonTruck Tube Curing | >85Δ | | OEE Flap Curing | >85Δ | | 03. | R.M. Inventory (No. of days) | 17 | | 04. | Work in process (No. of days) | 6 | | 05. | Finished goods inventory (No. of days) | 17 | | B. | CUSTOMER SATISFACTION INDEX | >8.5 | | C. | QUALITY INDICATORS | | | 01. | Total Scrap (R.M Value (%)) | 1.55 Δ | | Scrap Cured Tyre R.M Values (%) | 0.12 Δ | | Scrap Cured Tube R.M Values (%) | 1.0Δ | | Scrap Cured Flap R.M Values (%) | 12.8 Δ | | 02. | Seconds (Cured tyre) Saving on % Sales | 0.18 Δ | | 03. | Seconds (Cured tube) Saving on R.M Value | 0.26 Δ | | 04. | Compound downgradation (MT/Mon) | 8.00 | | 05. | Fabric downgradation (1000 Met/Mon) | 0.30 | | D. | ENERGY SAVING INDICATORS | | | 01. | Energy cost loss (Rs/Million/Month) | 3300 | | 02. | Power Consumption/(KWH)/Ton | 1250 | | 03. | Steam Consumption/Ton of Prodn. | 4.13 | | 04. | Power steam ratio KWH/MT | 302.6 | | E. | MAINTENANCE INDICATORS | | | 01. | Total Equipment failure (freq./Month) | 0 | | 02. | Maintenance cost (Rs./Ton of Production) | 1800 | | 03. | Total Equipment Maintenance cost (Rs../Ton of Prodn.) | 1300 | | F. | SAFETY INDICATORS | | | 01. | No. of accident in month | 0 | | 02. | Total man days lost due to accident | 0 | | G. | MORALE INDICATORS | | | 01. | No. of suggestions per person/Year | >2.5 | | 02. | Employee Satisfaction (Satisfaction Index %). | >85 |
| | | Table:2: Details of Training
| | Employees attended training programs | Year2009 | Year 2008 | Year 2007 | Year 2006 | | 1. Workman | 1498 | 1494 | 1490 | 1483 | | 2. Supervisors | 118 | 115 | 115 | 115 | | 3. Officers | 229 | 228 | 225 | 230 | | 4. Managers | 64 | 63 | 63 | 38 | | Status of the training | | Man hours | | Year 2008 | Year 2007 | Year 2006 | | 1. Workman | 73205 | 64665 | 56531 | 50665 | | 2. Supervisors | 11465 | 10357 | 9518 | 8750 | | 3. Officers | 11465 | 10357 | 9518 | 8750 | | 4. Managers | 3650 | 3424 | 3376 | 3251 | | % of the training per annum | | Year 2008 | Year 2007 | Year 2006 | | 1. Technical | 52.58 | 40.72 | 37.84 | 34.31 | | training | | | | | | 2. General | 52.40 | 40.70 | 39.27 | 38.69 | | Management | | | | | | training | | | | | | 3. Skill and | 38.57 | 34.24 | 32.53 | 31.21 | | attitude training | | | | | | 4. Retraining of | 05.50 | 04.91 | 04.17 | 03.71 | | workers | | | | |
| | | Table:3: Details of Training on Quality Management
| | Year | 2009 | 2008 | 2007 | 2006 | 2005 | | No. of Trainig programmes on quality | 6 | 4 | 3 | 3 | 2 | | No. of people attended | 557 | 535 | 521 | 469 | 413 | | Manhours spent | 1080 | 960 | 720 | 504 | 360 | | Training cost(in lakhs) | 21.60 | 14.40 | 10.08 | 6.3 | 3.6 |
| | :
| | Class room training | On the iob training | Practice training | | Annual training calendar | Fresher′s training | As and when required | | Standard training module | Annual training calendar | | | External training | Loss based training Multi-skill training | |
| | | Table: 4: Effects of Training on Quality Management System
| | SI No | Area of Improvement | 2008–09 | 2007–2008 | 2006–2007 | 2005–2006 | | 01 | Employee involvement (No. of kaizen topics) | 557 | 521 | 469 | 413 | | 02. | Raw material stores inventory (No. of days) | 21 | 21 | 21 | 21 | | 03. | Scrap generation (% of raw material cost) | 1.12 | 1.17 | 1.21 | 1.30 | | 04. | Power consumption (ton/kwh) | 1278 | 1281 | 1288 | 1291 | | 05. | Fuel consumption (ton/liter) | 18.10 | 18.20 | 19.11 | 19.31 | | 06. | Satisfaction level (%) | 91.57 | 90.34 | 87.88 | 84.21 | | 07. | Efficiency (%) | 98.72 | 97 | 94.31 | 92.13 |
| | | Table:5: Satisfactions on Training Programmes
| | Variables Under Study | Manager (n=10) | Officer (n=15) | Supervisor (n=22) | Workmen (n=40) | | Mean | SD | Mean | SD | Mean | SD | Mean | SD | | Training as a tool of bridging gap between existing and desired quality standard | 5.0 | 0 | 5.0 | 0 | 5.0 | 0 | 5.0 | 0 | | Training as a tool for increasing quality awareness | 5.0 | 0 | 5.0 | 0 | 5.0 | 0 | 5.0 | 0 | | Determination of training need based on requirement of quality management system | 4.8 | 0.42 | 4.5 | 0.74 | 4.1 | 0.56 | 4.05 | 0.79 | | Methods adopted for trainingon quality management system is appropriate | 4.8 | 0.42 | 4.5 | 0.74 | 4.1 | 0.56 | 4.0 | 0.79 | | Implementation of newly learned quality techniques in actual workplace | 5.0 | 0 | 4.6 | 0.48 | 4.2 | 0.42 | 4.2 | 0.67 | | Evaluation methods on training programmes based on quality | 4.8 | 0.42 | 4.5 | 0.74 | 4.1 | 0.57 | 4.0 | 0.79 |
| | | Table: 6: HR Practices supporting Quality management System
| | HR practices | Managers(n=10) | Officers(n=15) | Supervisers(n=22) | Workers(n=40) | | Mean | SD | Mean | SD | Mean | SD | Mean | SD | | Problem solving work group | 5.0 | 0 | 5.0 | 0 | 5.0 | 0 | 5.0 | 0 | | Self-managed workteam | 5.0 | 0 | 5.0 | 0 | 5.0 | 0 | 5.0 | 0 | | Individual incentive pay | 1.8 | 0.42 | 1.5 | 0.52 | 1.1 | 0.30 | 1.1 | 0.30 | | Group incentive pay Profit sharing | 5.0 1.0 | 0 0 | 5.0 1.0 | 0 0 | 5.0 1.0 | 0 0 | 5.0 1.0 | 0 0 |
| |
| | |
|
|
|