|
|
|
|
Computer Aided Classification of Breast Lesions in Digital Mammograms Sangeethapriya K.1, Dhivya Josephin Arockia1, Thamizhvani T. R.1, Hemalatha R. J.1 Department of Biomedical Engineering, Vels Institute of Science Technology and Advanced tudies, Chennai, India Corresponding Author: K. Sangeethapriya Department of Biomedical Engineering, Vels Institute of Science Technology and Advanced Studies, Chennai, India Email: sangeetha.se@velsuniv.ac.in
ABSTRACT Objective: Mammography technique is mostly used for detecting the presence of abnormal breast lesions among women. Differentiating these abnormalities is a most difficult task faced by the radiologists. By using this proposed technique the rate of unnecessary biopsies can be limited. This paper deals with an effective way of detecting the breast lesions using curvelet transform. This proposed paper follows a stepwise procedure such as (a) Preprocessing (b) Region of Interest Segmentation. (c) Applying Curvelet Transform (d) Feature Extraction & finally (e) Classification of features using different kernels of SVM. It is inferred from the observed results that the SVM(Linear) classifier showed a good accuracy rate of 80%. Top Keywords Mammogram, MIAS Database, Cancer Detection, Benign, Malignant, Curvelet transform. Top | Introduction Breast Cancer is considered as a most common type of lesion that has got great attention in the last few decades. This is because of the high death rates found among young women in the whole world. A Statistical report taken by Harvard School of Public Health[1] reveals that breast cancer cases will increase to 26% from now on till 2020 in the developing countries. With respect to this context, the diagnosis of breast lesions is totally dependent on radiologist’s ability to read and check the quality of the images. Computer aided designs helps radiologists to sort out abnormalities in the breast lesions. Medical Image processing[2] plays an vital role in this aspect. Candes etal[3] suggested a better approach namely Curvelet to explicitly track the shape of the discontinuity in mammograms and how this method differs from wavelet. In this approach only the discontinuities were only tracked. |
Meselhy etal[4], discussed a novel approach based on both curvelet transform and moment theory to classify mammograms. In this method, the variance feature for the first curvelet level alone is tested and produced 100% classification rate as well. The major problem in this method was that the other levels of curvelet showed misclassifications. Yoni Choukroun etal[5], proposed a novel framework for classification of mammograms and detection of abnormalities with no local annotations available in the data set, by detecting discriminative local information contained in patches through a deep neural network with the multiple instance learning paradigm. This method gave a better accuracy in classifying mammograms. The major drawback here was the absence of annotations by which verification of results remained impossible. To overcome all these drawbacks, a better approach has been proposed in this paper to avoid misclassification of images. |
Top Materials and Method Database for this work is taken from mini-MIAS. Each mammogram from the database has 1024 X 1024 pixels with a spatial resolution of 200 m/pixel. Detecting abnormalities from Mammogram images in this proposed methodology is divided into five stages. The first stage includes preprocessing of the image, the second stage includes the segmentation of Region Of Interest (ROI), the third stage is the extraction of curvelet coefficients using curvelet transform. The fourth stage involves extracting features from ROI and finally the fifth stage is the image classification process. The suggested system is worked out using MATLAB 2015a. |
The preprocessing step is performed in order to reduce the noise, enhance the image and remove the background area. It is difficult to differentiate between abnormal and normal lesions due to low contrast of mammogram images. The mammogram images were changed to gray scale. Its contrast was enhanced such that the output image’s histogram approximately matches a specified histogram and noise was removed from it using median filter. |
Segmentation: Segmentation[6] is an effective way for detecting the breast lesions in mammograms. The watershed method is used in this proposed paper. Segmentation using the watershed method includes identifying a mark on the foreground object and background locations. Watershed segmentation follows this basic procedure explained as follows: The first step is to convert the rgb images to gray-scale. Then an edge detection function is used to develop a gradient image. Morphological reconstruction is used for marking the foreground image. In order to obtain a good forward marker the regional maxima and minima are calculated. Finally the foreground marked image is superimposed on the original image. |
Curvelet Transform: Curvelet transform[2] is a new multi- scale transform based upon wavelet transform. Its factors include directions besides scale and position which makes it to have a better directional characteristics. In most of these images there are many curves. So here we must divide image into pieces, the curve is close to a single line in each piece. Then the image is decomposed into sub-band, and further it is divided into images with different scales into pieces. A better result will be acheived by all these process which includes subband decomposition, smooth partitioning and ridgelet analysis. Ridgelet analysis is the main algorithm which includes 2D FFT, interpolation, 1D IFFT in polar coordinate system, and 1D wavelet transform in Radon domain. |
Feature Extraction: Feature extraction plays an important role in classifying mammograms. Statistical features are used here to determine the texture of mammograms. |
Some main features that could be defined and calculated are mentioned below: |
1. Contrast: It is a measure of the intensity contrast between a curvelet coefficient and its neighbour of the entire image. It is given by the equation (2.1) as follows. |
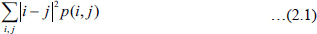 | ( (2.1) ) |
2. Correlation: It is a measure of how correlated a coefficient is to its neighbour over the whole image. It denoted by the equation (2.2) as follows. |
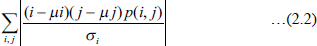 | ( (2.2) ) |
3. Energy: It is given by the sum of the square of the elements in the GLCM. Energy measures the textural uniformity which means the pixel pairs repetitions. It also measures the smoothness of the image. It is given by the equation (2.3) as follows. |
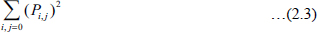 | ( (2.3) ) |
4. Homogeneity: It measures the closeness among the curvelet coefficients in the Gray Level Co-occurrence Matrix (GLCM) and GLCM diagonal. It is given by the equation (2.4) given below. |
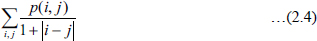 | ( (2.4) ) |
5. Autocorrelation: It describes how well an image correlates within itself. It can be observed under conditions where it is displaced with respect to itself in all possible directions. |
6. Entropy: Entropy is the measure of an image’s randomness that can be used to characterize the texture of an image. It is a quantitative measure of image information. It is denoted by the equation (2.5) below. |
 | ( (2.5) ) |
Top Classification Support Vector Machine: SVM is one of the supervised learning methods for classification and regression. They belong to the linear classifier family, generalized in nature. They can minimize and maximize the empirical classification error and geometric margin respectively. Therefore SVM is also known as Maximum Margin Classifiers. The input vector can be mapped to a high dimensional space where a hyperplane is constructed with maximal separation. At the each side of the data, two parallel hyperplanes are constructed such that it seperates the data. This seperating hyperplane maximizes the distance between the two parallel hyperplanes. In general, if the distance between the two hyperplanes is maximized by this separating hyperplane, the generalization error will be minimized. |
To understand the basics of SVM, a simple example can be explained where 2 different features are taken into account, namely x and y. A classifier is needed such that the given pair of output can be grouped. The SVM at first takes these given data and seperates it using a decision boundary, which into two groups. One falls on one side and the next on either side of the boundary. The distance of the hyperplane to the nearest element of each tag is the largest. |
In the case of non linear data, a new dimension named Z is calculated which is the third dimension in addition to x and y. It is given by z = x2 + y2 which will denote a three dimensional plane. Here the hyperplane should be parallel to x axis at certain Z. This is how a SVM classifies the input data. The algorithm of SVM is given below as follows. |
Algorithm 1.SVM: A set of mathematical functions used in SVM is called as kernel. Here SVM classifier whith three different kernels namely linear, Cubic and Quadratic are used. |
Top Results and Discussion In this paper, totally 20 mammogram images are used as inputs, out of which 10 are benign and 10 are malignant. Out of these 20 images, depending upon the abnormality classes, 7 images are circumscribed masses, 6 images are Ill-defined masses and remaining 7 images are with calcifications. Here 12 images are used for training and remaining 8 images are used for testing. |
A Sample of normal and abnormal mammograms from MIAS database with 1024*1024 |
The abnormal mammogram is preprocessed using contrast enhancement and noise is removed using median filter. |
Then the ROI from the preprocessed image is segmented using watershed method. |
Curvelet transform is applied for the segmented lesion and thereby the feature values are extracted from the obtained curvelet coefficients. They are shown in the Table 1 & Table 2 below. |
To validate the performance of classifier three different metrics have been selected, the measures are like accuracy, specificity and sensitivity are calculated based on the Actual and predicted values from confusion matrix, which consists of parameters such as True Positive, False Positive, True Negative and False Negative. Their formulas are given below as follows. |
Accuracy = (TP + TN)/(TP + TN + FP + FN) |
Sensitivity = (TP)/(TP + FN) |
Specificity = (TN)/(TN + FP) |
Where TP = True positive: Abnormality correctly classified as Abnormal. FP = false positive : Normal incorrectly classified as Abnormal |
FN = false negative: Abnormality incorrectly classified as normal, and TN = True negative: Normal correctly classifies as normal. |
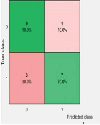
The execution of a classifier could be assessed as far as the quantity of TP and FP. The actual and predicted values are found for different kernels of SVM from the confusion matrix and are shown below in the figures 1, 2, 3 respectively. |
The performance analysis of these classifiers are found and are shown in table 3 below as follows. |
From the above analysis, it can be concluded that SVM classifier with linear kernel gives a better performance for classification when compared to other kernels. |
Top Conclusion In this paper, various steps were implemented for the breast lesions classification. The proposed approach consists of Image Preprocessing, Watershed Segmentation, applying Curvelet Transform, Feature Extraction [GLCM] and comparison of classification using different kernels of SVM. SVM(linear) proved its performance via performance metrics such as Sensitivity is 87.5%, Specificity is 75% and its Accuracy in classification is 80%. This system of classification shows better performance when compared with existing methods, so it is very helpful to the medical people in detecting tumor. |
Future Scope: In future, different classification techniques such as Bayesian, Gauda-Krishna Nearest Neighbor Algorithm etc can be done. A part from this, the sub classification of breast lesions can also be found. |
Ethical Clearance: This Study does not require Ethical Clearance. |
Source of Funding: It is one of the Self-funding work of Students of Department of Biomedical Engineering. |
Conflict of Interest: Nil |
Top Figures | Figure 1:: Confusion matrix–SVM (Linear)
|  | |
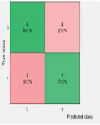
| | Figure 2:: Confusion Matrix–SVM(Cubic)
|  | |
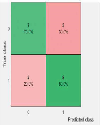
| | Figure 3:: Confusion matrix-SVM(Quadratic)
|  | |
|
Tables :
| | Algorithm | | 1. Load the Dataset. | | 2. Classify the given features, based on the class. | | 3. Find the estimation of support value. | | While (instances! =null) | | Do | | 4. Find the similarity between each instances in the attribute. | | 5. Estimate the error value totally. | | 6. If the instance<0 | | 7. Support value/Total Error = Estimated Decision Value | | 8. Until Empty Repeat again | | EndIf |
| | | Table 1:: Features of Benign Mammograms
| | Features Image No | Contrast | Correlation | Energy | Homogeneity | Autocorrelation | Entropy | | 1 | 0.001880 | 0.0006870 | 0.997000 | 0.999000 | 1 | 0.003887 | | 2 | 0.02400 | 0.01490 | 0.97300 | 0.993000 | 1.020000 | 0.05405 | | 3 | 0.006340 | 0.033000 | 0.9910000 | 0.998000 | 1.010000 | 0.007346 | | 4 | 0.02410 | 0.01490 | 0.967000 | 0.991000 | 1.0210000 | 0.04417 | | 5 | 0.009280 | 0.012000 | 0.9880000 | 0.9970000 | 1.0100000 | 0.008580 | | 6 | 0.051600 | 0.052500 | 0.9320000 | 0.9820000 | 1.0400000 | 0.061630 | | 7 | 0.020800 | 0.018900 | 0.9780000 | 0.9940000 | 1.0100000 | 0.020800 | | 8 | 0.031300 | 0.030700 | 0.9660000 | 0.9910000 | 1.0230000 | 0.031300 | | 9 | 0.06800 | 0.73900 | 0.92500 | 0.98500 | 1.25000 | 0.06800 | | 10 | 0.0467 | 0.03450 | 0.954000 | 0.988000 | 1.030000 | 0.04670 |
| | | Table 2:: Features of Malignant mammograms
| | Features Image No | Contrast | Correlation | Energy | Homogeneity | Autocorrelation | Entropy | | 1 | 0.03740 | 0.02580 | 0.95956 | 0.9891 | 1.0268 | 0.027408 | | 2 | 0.03322 | 0.01830 | 0.95587 | 0.988466 | 1.026769 | 0.013225 | | 3 | 0.06677 | 0.027307 | 0.93085 | 0.981414 | 1.04765 | 0.05678 | | 4 | 0.03582 | 0.03601 | 0.95284 | 0.98777 | 102943 | 0.02852 | | 5 | 0.04903 | 0.05479 | 0.95049 | 0.986853 | 1.035110 | 0.03902 | | 6 | 0.02394 | 0.03615 | 0.97146 | 0.992531 | 1.01835 | 0.03384 | | 7 | 0.03740 | 0.04870 | 0.95674 | 0.988633 | 1.028814 | 0.02740 | | 8 | 0.03170 | 0.00908 | 0.95811 | 0.989027 | 1.025068 | 0.01176 | | 9 | 0.06860 | 0.01593 | 0.92093 | 0.978894 | 1.05174 | 0.0386 | | 10 | 0.0352 | 0.03222 | 0.96699 | 0.99118 | 1.023185 | 0.02522 |
| | | Table 3:: Performance Analysis of classifiers
| | Classifier (kernel) | Accuracy | Specificity | Sensitivity | | SVM (Linear) | 80% | 75% | 87.5% | | SVM (Cubic) | 75% | 77% | 72% | | SVM (Quadratic) | 75% | 88% | 77% |
| |
| REFERENCES | | 1.. | KhokharAnita; Breast Cancer in India: Where Do We Stand and Where Do We Go?” : Asian Pacific Journal of Cancer Prevention:2012: Vol 13. TopBack | | 2.. | Dr.AroraShaifali Madan; Anshul Pareek: Breast cancer detection techniques using medical image processing: International Journal of Multidisciplinary Education and Research: May 2017: Volume 2: Issue 3:Page No. 79–82. TopBack | | 3.. | StarckJean-Lue, CandesEmmanuel J., DonohoDavid L.: The Curvelet transform for Image Denoising: IEEE Transactions on Image Processing: June, 2002, Vol 11, No 6. TopBack | | 4.. | EltoukhyMohamed Meselhy; Mammographic Mass Detection Using Curvelet Moments: An International Journal of Applied Mathematics & Information:2016. TopBack | | 5.. | ChoukrounlyYoni, BakaloRan, Ben-AriRami, Askelrod-BallinAyelet, BarkanElla, KisilevPavel: Mammogram Classification and Abnormality Detection from Nonlocal Labels using Deep Multiple Instance Neural Network: Eurographics Workshop on Visual Computing for Biology and Medicine : 2017. TopBack | | 6.. | ChengH.D., JiangX.H., SunY., WangJingli: Color image segmentation advances and prospects :Department of Computer Science, Utah State University, Logan, UT 84322-4205, USA-12: September 2000. TopBack | | 7.. | GanesanKarthikeyan, AcharyaU. Rajendra, ChuaChua Kuang, MinLim Choo, AbrahamK. Thomas, Kwan-Hoong:Computer-Aided Breast Cancer Detection UsingMammograms: A Review- Ng Methodological Review: IEEE Reviews in Biomedical Engineering:2013: VOL. 6. TopBack | | 8.. | LotheSavita A.l, TelgadRupali L, SiddiquiAlmas.l, Dr.DeshmukhPrapti D:Detection and Classification of Breast Mass Using Support Vector Machine: IOSR Journal of Computer Engineering (IOSR-JCE) e-ISSN: 2278-0661, p-ISSN 2278-8727, PP 01-06. TopBack | | 9.. | basherKhalid, SharmaAnuj:Review Paper on Classification on Mammography: International Journal of Engineering Trends and Technology (IJETT) : Aug 2014: Volume 14 : ISSN: 2231-5381. TopBack | | 10.. | HedawooMonika, JaiswalAbhinandan, MehtaNishita :Comparison of Data Mining Algorithms For Mammogram Classification: July 2016:ISSN: 2320-2084 Volume-4:Issue-7. TopBack | | 11.. | VijayalakshmiS, PriyadarshiniJ: Breast Cancer Classification using RBF and BPN Neural Network: International Journal of Applied Engineering Research :2017: ISSN 0973-4562 :Volume 12: pp. 4775-4781: Number 15. TopBack | | 12.. | Dr.DevakumariD.; Punithavathi: Study of Breast Cancer Detection Methods using Image Processing with Data Mining Techniques: International Journal of Pure and Applied Mathematics:2018:Volume 118 No. 18, 2867-2873. TopBack | | 13.. | DeshmukhJyoti, BhosleUdhav, A Study of Mammogram Classification using AdaBoost with Decision Tree, KNN, SVM and Hybrid SVM-KNN as Component Classifiers: Journal of Information Hiding and Multimedia Signal Processing: May 2018:Volume 9:Number 3. TopBack | | 14.. | JehloHashem B., AbdalrdhaZainab khyioon, OleiwiAnwer Subhi Abdulhussein:Classification of Mammography Image Using Machine Learning Classifiers and Texture Features: International Journal of Innovative Research in Advanced Engineering (IJIRAE) :Sep, 2015:Issue 9, Volume 2. TopBack | | 15.. | KanchanamaniM, VaralakshmiPerumal: Performance evaluation and comparative analysis of various machine, learning techniques for diagnosis of breast cancer: Biomedical Research2016: 27 (3): 623–631. TopBack |
| |
|
|
|