Introduction During the twentieth century, productivity issues have received significant attention. National concerns about productivity management have been brought about by the agenda of global competition; since, the rate of growth in productivity always determines a nation’s economic and social progress. Productivity measures to what extent the available resources of an organisation are being used effectively for transforming inputs into outputs. With the recent growing emphasis towards Total Quality Management, Sustainable Develop-ment, Business Process Reengineering, ISO-4000 etc., the productivity policies have undergone a paradigm shift. This shift is towards Green Productivity (GP) through Clean Manufacturing Practices (CMP). |
Green productivity is at the heart of the concept of sustainable development. Development means transformation, growth, and change. Green productivity issues are increasingly reflected in business decisions. No business that strives to remain competitive, open to new markets and new opportunities can afford to ignore the global demands for environmental quality The corporate world looks now at cleaner production - the concept of preventing waste generation at source - as an opportunity for improvement and long-term sustainable growth. Adopting CMP can greatly reduce pollution control costs, and, at the same time, increase profit and efficiency. Cleaner production processes are those that produce less waste, whether in terms of liquid wastes discharged to waterways, slid wastes going to landfill or gaseous wastes discharged to the air. Many companies have achieved environmental and economic benefits by implementing cleaner production programs. |
All organisations in the developing world are attempting to harness all the available resources putting uncalled for pressures on the physical environment. Hart1 echoes this concern in terms of corporate greening programs. Green productivity signifies the search for technologies that reconcile the need for higher output with the mandate to protect the environment. It is a global perspective and a philosophy of organisational transformation, not a set of techniques. It is being adopted as one of the important means to manage operations more innovatively, responsibly, and, ultimately, on a more sustainable competitive basis. Hitomi2 argues for green production, as the socially appropriate production based upon the satisfaction-consciousness spirit is vital in the coming age. Although it is a new and still an evolving concept, Cooley3 has pioneered the notion of green production. GP is an evolving concept drawn from the integration of two important developmental strategies, specifically productivity improvement and environmental protection. Green Productivity provides the framework for continuous improvement while environmental protection provides the foundation for sustainable development. The objective of green productivity as we envisage is simply to produce more quality (environment-friendly) output from less inputs through clean manufacturing, yet enabling organisations to contribute to the emancipating mission of integrating economic development, social progress, and ecological balance. Reducing waste and pollution and using less energy and material resources are obviously good for the environment, but evidently the best for business because they cut operational cost. Productivity concept is being integrated with environment protection, which is called as “Green productivity”, that is to generate no waste and pollutants in manufacturing, use and maintenance to minimize life cycle costs and minimize negative impacts on society. |
Top Green productivity movement leads to organisational transformation Resource productivity is fundamental in the green productivity management concept. Increasingly, resource productivity will become an important yardstick against which stakeholders will measure a company’s performance. Collis and Montgomery4 mentioned about competing on resources will be the most dominant strategy in the future years to come. They argued that a company would be placed in a competitive advantageous position if it has the best and most appropriate stocks of resources. We argue here that such resources are environment-friendly and optimised with respect to the value maximisation for the stakeholders. Waste minimisation is being considered as an important strategy towards attaining green productivity.5 Any non-value adding activity carried out in any operation can be defined as a Waste i.e. anything that does not add value to saleable product as demanded by the customer. Waste gets manifested in various forms.6 Like productivity, we define here wastivity as the ratio of wastes of all kinds to the total inputs. As an extension to this, the net wastivity can be defined as a ratio of net of all wastes minus recycled quantity to the total inputs. We postulate here that there exists an explicit and tangible relationship between resource productivity and wastivity. By minimizing the wastivity, one is promoting resource productivity in multiple dimensions, because any waste results in the misutilisation of precious resources. Companies that will manage their resources more efficiently will gain competitive advantage not merely in the market place but in the overall development pace. There is an emergent need for a sustainable development today. On this background, the matrix shown below can be taken as a guide for measuring the concern towards resources and production in a typical organisation.
Organisations, which have low concern for both production and resources, need critical attention, whereas the organisations which give more emphasis on production but has low concern for resources would be producing defective products and thus would be generating more waste which is harmful for the society. Similarly, the organisation having high concern for resources, but low concern for production would be saddled with making inadequate profits because of low volume of outputs due to excessive generation of waste. On the other hand, an organisation having high concerns both for production and resources would be a significantly transformed organisation due to its perpetual emphasis on waste elimination. Such organisations, in general, draw the following objectives:
|
Market Leadership Objectives To strengthen technical and innovative capability and develop new areas of business potentials and competencies. To retain environmentally responsible customers as well as suppliers and expand to new markets. To change or improve the market image of the company.
Risk Management Objectives To prevent risks (to anticipate the changing regulatory and market context rather than to react to changes as they are upon them). To recognize the emergence of a new business paradigm and a new competitive terrain. To influence the direction of regulations and legislation.
Social Responsibility, Health and Safety Objectives To act responsibly as corporate citizens. To improve health and safety conditions for the employees. To improve the internal climate and working conditions.
Green productivity is about doing more with less: less time, inventory, space people and money. Imitation of customer relationships, fast product development and manufacturing and collaboration with suppliers are the key strategies of leading green companies. Such companies generally follow the strategies:
Focus is on production value stream, eliminating non-value added operations: storage, transportation, and inspection. Waste is eliminated through continuous improvement efforts. The lean manufacturing mindset: concept, way of thinking - not techniques; culture - not the latest management tool. Continuous product flow is achieved through physical rearrangement and system structure and control mechanisms. Single-piece flow/small lot production: achieved through equipment set up time reduction; attention to machine maintenance; and orderly, clean work place. Pull reduction/Just-in-time inventory control. Layout is based on product flow. Quality of each item is assured during processing.
This matrix helps in understanding the relative concerns of an organisation for production and resource utilisation. It focuses as much on value creation as on resource use or waste minimisation. The goal is to create value for the stakeholders by doing more with less. Smith7 argues that such a concept can be seen as securing other business advantages over competitors. Enterprises, which are enabling higher and a better capacity and cost management, are making more investments in assets with environment-friendly processes. The cumulative effect leads to even higher competitiveness in global business such as; building global presence, defending domestic dominance, overcoming environmental fragmentation etc. Companies with more stringent clean manufacturing practices have succeeded in promoting efficient usage of resources and technological innovations and developing competitive advantage. There are two basic types of competitive advantage; Total Productivity and Total Quality8. Both are the strategic interventions in any firm’s operations related to total elimination of wastes. Mohanty and Lakhe9 have explained a linkage model between quality and waste. Mohanty10 has established a model inter-linking quality and productivity. All these models are concepts and fundamental building blocks to understand, explain, apply and integrate the implicit and explicit linkages between profitability, productivity, quality, and wastivity. However, these models may not be accurate predictive instruments but can be construed as tools for total system interventions, and organisational learning and change towards green productivity movement. From such interventions and learning, strategy formulation may become much more pragmatic, and implementation would be transformation-oriented. Top Strategic Directions Towards CMP Primarily, the CMP has two dimensions Structural Dimension: Here the waste may be generic from the structural configuration of the system. The unwieldy and bureaucratic structure of an organisation may be responsible for the generation of the wastes. Process Dimension: Here the waste is generated because of process technology, work system design, control mechanisms etc.
Generally, the activities undertaken in any work system are of two type11 Value adding activities: Activities, which add, value (as perceived by stake holders) to the product and thereby contribute towards revenue generation for an organisation. Non-value adding activities: Activities, which do not add any value to the stakeholder and go down only as cost.
The non-value adding activities can further be divided into two categories; namely, correcting wrong things (e.g. rework), and essential secondary activities (e.g. accounting, material handling etc.). The non-value adding activities of the first type can be defined as waste. Also incorrect ways of doing essential secondary activities lead to waste, as they do not add any value to the product. Productivity in quantifiable terms represent the percentage, that the value adding activities out of the total activities undertaken in an organisation. Similarly, wastivity can be represented in quantifiable terms as the percentage, that non-value adding activities out of the total activities undertaken in an organisation. However, all the non-value-adding activities need not necessarily be waste (essential secondary activities) but such activities are discretionary. When discretionary activities are large, costs go up reducing competitive advantage. Then, for a firm, one can interpret:
 | ( 1 ) |
Where, productivity = output (product/services)/input (resources) Thus wastivity can be interpreted as the part of resources, which are not used efficiently. Also, as we define Total Factor Productivity and Partial Productivity12, same way total and partial wastivity (including Resources wastivity) can be defined. A resource is used in a system which processes the inputs into outputs; either as an input (material, information) or for processing the input. But as such, any resource becomes an input to a system. Essentially, the following waste categories can be identified:
Waste-I: The resource, which is used as input to the system may lead to some wastage (e.g. faulty raw materials leading to rejection etc.). Waste-II: The resource is transported to the point of use and stored there till it is used. This leads to wastage (e.g. waste in electrical energy, heat energy or compressed air being transmitted and waste of space due to storage of WIP). Waste-III: During actual process, the inputs are converted not into outputs, which lead to certain amount of wastage (e.g. in process rejection, loss of important data during processing of information). Waste-IV: The product/service which is ready and is transported to and stored at the point of use and can lead to some wastage (e.g. Deterioration of products due to limited shelf life, handling damages etc.).
All these categories of wastes result in reduction of the total productivity of the system. The same systems framework can be used to represent the flow/use of each resource in a particular system to demonstrate how the wastes are taking place. From this argument, we can develop the following relationship between productivity and wastivity:
 | ( 2 ) |
 | ( 3 ) |
We define some of the indicators for measuring wastivity. They are presented in Table 1.
Generally, there is a lack of metrics to measure wastivity in many organisations. These multiple measures can be used as a framework to plan, organize, and track productivity growth for an enterprise. There are different types of strategic initiatives and tactical directions for improving productivity. Mohanty and Rastogi have outlined the following strategies:
Growth oriented Cost reduction Technical efficiency Organisational effectiveness.
The appropriateness of such strategies is shown in the matrix below:Eilon et al.14 have mentioned some micro-level action plans for productivity improvement:
Substitution of machine or new technology for human effort. Use of improved methods to do work. Adoption of people oriented-management policies. Elimination of wasteful or non productive practice.
However, there is a very little research to suggest strategic directions for managing wastivity. Naderi mentioned that the real solution to waste management lies in the productive design approach. We feel that such an approach is restrictive, therefore, the approach must encompass a life-cycle perspective. It is logical therefore, that company should formulate strategies to improve their environmental performance and conserve resources throughout the process by focussing on value creation and innovation. We therefore submit here four possible strategic directions:
Waste Reduction Waste Control Waste Avoidance Waste Prevention
The first two strategies could be classified as corrective initiatives based on posterior or reactive mode. Waste reduction strategy aims at prudent budgeting of resources for generating more value added outputs. Waste control strategy holds the amount of resources according to a prescribed standard and attempts to be made to generate more yields. These strategies deal with identifying the recurring low productivity problems in a manufacturing process and redirecting the resources for efficient utilisation. Whereas, the other two could be classified as preventive strategies thus attempting to eliminate the wastes completely—an ideal goal from total productivity point of view. These strategies could be proactive and a-priori measures based on the understanding of the underlying manufacturing process to predict and influence in multiple dimensions the sources of generation of waste, inherent bottlenecks in design, layout and operating systems. All these strategies require multifaceted analysis, mapping different processes, focusing on key bottlenecks and bringing potential synergy between value adding elements. Primarily, it may be necessary to take corrective initiatives and attempting to minimize them; and subsequently to adopt the preventive approach leveraging it in place of corrective approach. The cumulative and continuous directing of companies efforts towards the identification of waste and strengthening of such activities are most vital for the growth of total quality and productivity. United Nations Environment Programme16 suggests that clean production can be achieved by adopting diverse practices such as the tools and techniques of quality control and productivity improvement. Jesdapipat17 mentions about green productivity as combinations of green input, green technologies and green management. According to him, green management is the software, which determines the ‘what’ and the ‘how’ from input flow to output delivery so that minimum environmental impacts can be assured. We submit here that these strategies have to be viewed in a total system perspective, because the outcomes of strategic thinking are an integrated perspective of any enterprise. A total systems approach towards green productivity management The progression from business-as-usual to green productivity involves two major paradigm shifts:
From a focus on internal efficiency to value adding benefits, From a tactical to strategic concern for resource configuration and optimisation.
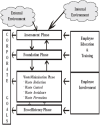
These two paradigm shifts call for preview, review and projection of design, layout, methods etc. through a total system intervention. Once these shifts are absorbed by the extended enterprise, from top to bottom, it can begin to take strategic initiatives and make the requisite changes to implement multitude of clean manufacturing practices that can support and sustain green productivity enhancement. System interventions can be invaluable by constructing a pragmatic map of the green productivity policy terrain in which to search for effective implementation steps. Such intervention became important for learning to facilitate a new field for future action research. Dumble18 talked about appropriately structured waste minimisation approaches and highlighted that such approaches are the essential building blocks that can reinforce wider environmental management systems. Phillips19 had proposed a methodology for tackling waste minimisation projects, which could help in delivering real results for Northamptonshire. Berkel20 has contributed to the development of appropriate approaches, tools and policies that may foster the future implementation of cleaner production. We derive our total system intervention model not only from Berkel’s practically demonstrated projects in Asia or Phillips demonstrated projects in Europe, but from General Systems Theory (GST)21. Our model is a projection towards corporate response to attain the global goal of sustainable development. Figure 1 is a schematic representation for a total system intervention. It is to be carried out in four phases:
Assessment phase Foundation phase Waste minimisation phase Eco-efficiency phase
Assessment Phase In this phase, an assessment is generally to be attempted to have theknowledge relating to organisational climate and impedimentsto change management. The methodology may be structuredinterviews or questionnaire survey or any otherorganisation developmentintervention technique. The basic objective of this phaseis to develop a comprehensivecheck listwhich can facilitate in identifying different type of wastes, obtaining primary information about theri genesis and modalities and skills needed to make meaningful interventionsin the various processes carried out in the organisation. Foundation Phase Managing green productivity through clean manufacturing is a change manage-ment approach thatmay require three different but simultaneous initiatives. They are:
Evolving a mind-set for total waste minimisation: This initiative focusesupon contextual factors such as values, structure and new performannce measures - which can drivechange through the existing authority and contrl structure of the organisation. Creating a sense of urgency for clean manufacturing: This initiative is top-down directed wherein the top management engage the total organisation to realize, commit, mobilize and innovate. Directing the efforts in multiple dimensions: This initiative concentrates on strengthening communication network, employee cooperation, self managing teams, etc. which can primarily work on a number of direct issues to generate the maximum productivity and quality impacts and then move forward to indirect and support issues.
Waste Minimisation Program Phase (WMP) The objective of this phase is to expand the scope of efforts in such a manner that culture of waste management becomes a regular practice. During the assessment phase, the gaps are identified and in the foundation phase the organisational climae towards change management created. In the waste minimisation phase, based on the gaps identified, strategic directions and action plans are to be formulated. Strategic directions, such as waste reduction, waste control, waste avoidance, and waste prevention need to consider the following important factors:
Policy guidelines Planning emphasis Organisational approach Training and development Management processes and systems Project planning and implementation The first of which may involve preliminary modifications like layout replanning, time and motion study to identify and eliminate bottlenecks in the operating systems and other maintenance and house keeping activities. The second step comprises of identification of waste reduction and control opportunities, determining the quantity and quality for wastes generated, and making detailed process and equipment modifications required for minimizing waste generation and maximizing the product yield and quality. The third step recommends waste avoidance and prevention guidelines. The ultimate goal of this phase is to bring significant performance improvements, to cut costs, boost competitiveness and benefit the stakeholders.
Eco-Efficiency Phase During this phase, a post-audit may be necessary to evaluate the degree of waste minimisation and process improvement achieved in the earlier phase. Eco-efficiency is the means for organisations to improve their environmental performance and save money by reducing resource use through out the life cycle. Apart from post auditing, which is carried out to evaluate the status; there is a need to build up the following practices:
Building environmental stewardship into the corporate fabric and aligning manufacturing strategy with the environmental policy. Setting targets for improving green productivity and designing systems to track, measure and enforce these targets. Innovating methods for waste avoidance and prevention on a continuous basis.
Eco-efficiency will be the business norm for the 21st century. The ultimate mission is to achieve a better quality of life for every one. Eco-efficiency is a strategy for enhancing productivity and environmental performance for overall socio-economic development. It is the application of appropriate environmental and productivity techniques, technologies and management systems to produce environmentally compatible goods and services. Top Study of Some Select Companies Pursuing CMP The authors were involved in organizing and conducting a series of management development programs on the subject theme “Total Productivity and Total Quality Management (TPQM)”. One of the modules of these programs was devoted to green productivity and clean manufacturing strategies. The authors got an opportunity to make a survey to assess the status of clean manufacturing initiatives in Indian manufacturing companies. A questionnaire was designed for this purpose. Such a questionnaire is presented in Appendix I. These questionnaires assume different stages in progression of green productivity and clean manufacturing initiatives. These stages are defined in Appendix II. The questionnaire was administered among 100 different company executives. The findings were used to identify 3 best practitioners. We selected the best practitioners by identifying the three companies that scored highest on our questionnaire. The objective here is to create awareness and build a knowledge base relating to green productivity and clean manufacturing strategies. The three organisations reported in this paper are:
| | Organisation | Engaged in Manufacturing of |
| | ALPHA | Chain Pulleys/Hoists | | Beta | Steel Products | | Gamma | Automobile Transmission System Products |
|
|
|
We make a synoptic discussion on these organisations based on our OD intervention in the following sections. |
Top Alpha ALPHA was established, as a small family owned company about 60 years ago in technical collaboration with a German Multinational had Chain Pulley Hoist as its main product. Later, they extended their product line to other products like Chain Electric Hoist, Wire Rope Electric Hoist etc. The machinery was bought in for production of 4800 units of Chain Pulley Hoists and 1200 units of Chain Electric Hoists per annum. The technical collaboration within the General Company ended in 1970. In due course of time, the company started manufacturing indigenously Chain Electric Hoist. After gaining 5 years of experience in this field, it went on to develop Wire Electric Hoists also. Over the years, the design department has extended the range of products offered under Wire Rope Electric Hoist category and also have made significant modifications in Chain Pulley Hoists after knowing the quality problems and customer requirements. The product range includes the following: Pulley Hoists, Chain Electric Hoists and Wire Rope Electric Hoists. These products are used in all types of industries where speedy lifting is required. |
Due to initial good German design, help extended by German Engineers in facilities and layout planning and procurement, better financial strength, improved quality compared to the competitors, good selling network and constantly increasing product portfolio; the company has established a brand image. Even though prices are 15–20% higher compared to other products in the market, the company has cornered about 65% of marker share in complete range of its products. ALPHA is also developing some new specialised products like Specialty Cranes and Automatic Storage and Retrieval Systems to cater to the dynamic needs of its customers. In recent years, the company is concerned about the emerging Korean and Chinese competitors who are offering robust hoist at 30% cheaper prices. The company is on the threshold of life cycle for some products, where it has to improve its productivity to survive in competition. It was imperative for the company to control its costs by eliminating all the non-value adding activities and wastes. The topmost priority for the company officials was to identify the possible sources of wastes, explore the symptoms of waste, trace back and pinpoint the implicit and explicit causes manifested and device action plans not only to correct but also to prevent from future occurrences. They used variety of methods such as quality circle, suggestion schemes, value engineering, activity analysis, process mapping etc. We could document the wastes identified and measure some of them and we present such findings in Table 2.
|
The following points are worth mentioning:
Use of group technology layout: Similar types of machines are grouped together so that every product line has a process flow or sequence through a dedicated set of machines only. Implementation of single piece flow and automatic material handling will become simpler. This will eliminate the batch delays when a component is finished on a machine; it is immediately passed to the next machine without waiting for the remaining components in the lot to be machined. This will lead to reduction/elimination of WIP inventory. The cellular layout of manufacturing will allow for future expansion and will facilitate material handling automation. Layout modification/extension for complete plant: The high degree of non-value added movement time can be eliminated throughout the plant by optimizing existing layout for each product category. Combining these optimum individual layouts using layout-planning software, we got most feasible layout, which minimizes wastage of time and space. Use of MRP System: If initially a manual MRP system for planning of capacity, material requirement shop floor scheduling and control is developed, it will result in reduction of waste like material pilferage/unaccounted scrap. It will also help to reduce waste in raw material and WIP inventory. Gradually, it can be computerised. Proper routing and backward scheduling of machines will reduce idle time of labor. It will reflect on the financial performance by reducing of material costs, labor costs and better delivery performance. Thus in short, elimination of losses can result in better customer and employee satisfaction. Expediting Jigs/Fixtures and tools manufacturing for vertical milling machine: The company does not have a separate tool design department, for designing/development of tools, jigs/fixtures for Vertical Machine (VM). If these are out-sourced, the idle time of VM will drastically reduce. Replacement reconditioning of obsolete machines: Gear shaping and Gear hobbing machines should be immediately replaced by higher capacity new technology based gear cutting machines. Similarly, Grinding and small Gear machines require reconditioning. This will greatly reduce the machine down time because of frequent mechanical and electrical problems. Debottlenecking the lathe: Piling of WIP before the burning lathe used for electrical hoist drum can be avoided by debottlenecking. Subcontracting additional capacity for transferring some of the components to VM can do it. This will in turn increase the utilisation of VM, thereby reducing machine and human wastage. Use of multiple skills: To reduce machine wastage a long-term possible solution is to impart, multiple skills to workers so that some different labor may run the machine when a particular operator is absent. Improved communication format for Quality Assurance and Production: To avoid the duplication of paper work by Quality Assurance and Production Department for accounting daily partwise production, rejection etc., a new format is suggested. To know the exact cost of warranty complaints and its percentage value, proper documentation of customer complaints of field failures must be available. This is possible if monthly aggregated product-wise information is maintained. This information will highlight the major failures commonly occurring and corrective actions to the top management.
|
Top Beta This case deals with the identification of wastes and its impact on Total Productivity. The company under consideration BETA is a large scale integrated steel plant located in the eastern part of India established in the year 1959. The company is in the business of manufacturing and selling Merchant and Section products with a turnover of over Rs. 200,000 million and has been a consistent loss as maker for the last few years. The management feels that a prime cause of the losses relate to the low level of productivity prevalent in the plant which is probably due to the high incidence of wastage in the different activities of the plant. This steel plant consists of a nos. of sub plants namely - Blast furnace, Steel melting shop, Coke oven plant, Section mill, Merchant mill, Roll shop etc. For the purpose of our study, we have selected Roll shop, as we believe that it will give a fair picture of the seriousness of the problem of wastage. Roll shop is the heart of the integrated steel production system. The main activities of roll shop is to cater to the roll requirements of all the rolling mills and is basically divided into three sections viz. Design, Main Roll Shop (MRS), Skelp Roll Shop (SRS). MRS supplies rolls to merchant mill and section mill. SRS supplies rolls only to skelp mill. There are 9 lathe machines and one groove-cutting machine in MRS that are mainly used for rolls turning. SRS is having one turning and one grinding machine. Template making and tackle finishing are also done at MRS. |
The basic purpose of roll shop is to cater the requirement of rolls of the various rolling mills. As one run of particular section is complete, rolls are brought back to roll shop and kept in the specific rake. As the need for rolls arises, rolls are identified and taken out of rakes. It is followed by setting up the rolls at the respective lathe with the combined effort of indirect labour, lathe operator and shift incharge. Turning or grinding of rolls is completed using tools and templates. As the turning of rolls is over, intimation of these rolls is sent to respective rolling mill. |
We have documented six major categories of waste and such a document is presented in Table 3. Like Alpha, we could not obtain data to measure levels of wastivity in different categories. This company needs to do a lot in areas of waste minimisation in order to make the steel production system competitive in terms of international standards.
|
Top Gamma This case refers to identification and minimisation of waste undertaken for a large automobile manufacturing company. The company has three manufacturing facilities, strategically located in different parts of the country, to be closer to the market and source of cheap and skilled labor. The company has its models entrenched in all the market segments of automobiles, except the small car segment. The transmission division manufactures gearboxes (with all its parts like gears, shafts etc.) and the rear axle parts like driving pinion, crowning wheel etc. The manufacturing process is briefly explained follows: |
Raw material/semi finished parts enter the transmission division wherein they are processed in the soft machining area. After soft machining, the parts are heat treated to achieve the required metallurgical properties. After heat treatment, few components go directly to gearbox assembly, while others are ground, honed in the hard section. In gearbox assembly, the parts received from heat treatment, grinding and stores (finished components) are assembled to form the gearbox. This gearbox is then tested and dispatched to engine division for mounting on the engine. |
The word productivity meant only labour productivity (being labour intensive) in this company, till technological up-gradation (shifting it towards capital intensive) forced the management to take steps towards the control of other resources also. With the continuing technological upgradation, the cost of resources, other than the labour, formed a large part of the total cost structure. With the entry of the world’s best automobile manufacturers in India, the company decided to undertake cost cutting exercise, to survive in the increasing competition. |
A cross-functional team approach was used to identify and suggest action plan for waste management. Table 4 presents the findings of this case. Although we could not obtain data to measure wastivity, we could quantity the projected savings in monetary terms due to clean manufacturing practices.
|
Top Some Significant Observations Through our interventions in the above-mentioned three companies, we could observe a number of common issues: In most of the cases, the management initially does not realize any wastage in the system, because they are in the “business-as-usual” mindset. Further, the senior managers are so busy in their routine fire-fighting operations and meeting daily production targets that they are left with no time to articulate eco-efficiency and sustainable develop-ment paradigms. Although, some managers are aware of the implications of the non-value added activities, their focus is always on rework but not on prevention level rather than the strategic level. Most attempts made towards waste minimisation, remain at the operational level rather than the strategic level. Most activities are confined to the factory floor and there is vast scope for application in other areas of the business. Education and training programs for employees at the middle and operational level are a must for better appreciation of the waste and understanding its linkages with total productivity. The waste minimisation needs are to be directed at a strategic level requiring an active involvement from top management. The waste is ultimately linked to resource utilisation, hence its implications for clean manufacturing and green productivity need to be emphasised at all levels. All these companies use multifaceted analysis focusing on key bottlenecks and mapping different activities. However, most of the managers have expressed the following difficulties:
Incompatible mindset communication problem Spatial separation of facilities and people Potential conflicts of interest Competition for resources
We suggest that corporate managers should be the frontline people in green productivity movement, and they should carry out the following tasks:
Undertaking an initial assessment of the status of wastivity in the organisation, Setting up clean manufacturing strategies, Developing internal performance criteria, Establishing green productivity objectives and targets, Designing green productivity program, Implementing the program, Providing sufficient resources for the programs implementation, Defining accountability and responsibility for programme implementation, Providing adequate training for staff, Communicating and reporting, Establishing and maintaining documentation systems, operating procedures and controls, Monitoring the performance, Reviewing and improving the status of green productivity management programs.
|
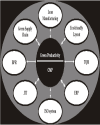
The future of Green Productivity Movement is dependent upon the interaction of myriad of practices, which can be clustered, in a conceptual form as depicted in Figure 2 |
Top Concluding Remarks Green productivity is diffusing rapidly as a philosophy to increase the level of innovation in organisations and is being characterised in manufacturing strategy in terms of a long-term development program. Moving towards green productivity requires some considerable investment in human resource development. These developments may be of three types:
Cross-functional and interdepartmental development, which should look at the overall organisation and interaction between the subsystems. - Functional development should focus on the development in one of the functional areas and it’s associated processes. This development should address the needs for specialisation.
Local development should be concerned with the individual company unit responsible towards a certain part of the routine operation, for example; Production flow analysis, Activity chain analysis etc. can make it easier to define the local tasks and identify appropriate decision variables.
|
This paper, by combining different perspectives, may provide a basis for a fruitful discussion as a step forward to enhance knowledge base about green productivity. We believe that success of green productivity movement requires holistic knowledge, to discover the needs for change and to develop creative ideas and selection of clean technologies for amplification and impact. |
Success of Green productivity can be represented as an equation given as follows: |
Green Productivity = (The ability of formulating clean manufacturing strategies) (The ability to make the wastivity target clear) (The ability to innovate to eliminate waste) (The ability to implement the strategies). |
Green productivity through clean manufacturing includes some features that should be inclusive in strategic manufacturing approaches. It focuses on value creation for the stakeholders, but its ultimate mission is to enhance the quality of life for the human system. The concepts and the total systems approach presented in this paper are essentially not complex. They propose that waste in any form can both be corrected and prevented, but they can be achieved by adhering to the fundamental and generic principles of total productivity and quality management. However, our model presented in this paper provides merely an opportunity (which is hitherto missing in contemporary manufacturing strategy literature) for learning, which according to us should be taken up, if the managers have the ability to unravel what has been the experiences from what has to be learned, and the motivation to carry out a priori and posterior articulations and analysis. |
In the years ahead, the organisations have to pursue their current thrust of world class manufacturing strategies with even greater vigor. We submit that this thrust is to be backed by professional dedication to the highest standards in clean manufacturing, marked by creative fusion of generic principles of productivity and quality and strong commitment to environmental protection. This means that in every green productivity project, there must be a place for merging technologies with environment into a seamless integrated whole, creating new standards for quality of life in the 21st century. |
Top Figures | Figure 1: A Total System Model
|  | |
| | Figure 2: Elements of Green Productivity Project
|  | |
|
Tables | Table 1: Some indicators of wastivity
|
| | Gross Wastivity | = [Total waste generated/Total Input] | | Net Wastivity | = [Net waste generated/Total Input] | | Material Wastivity | = [wasted material cost/input material cost] | | Human Wastivity | = [wasted human resource (nos. of hours)]/[available human resource (nos. of hours)] | | Machine Wastivity | = [wasted machine time/available machine time] | | Space Wastivity | = [wasted space/available space] | | Energy Wastivity | = [wasted energy (kW-hr)/energy consumed from power bills] |
| | | Table 2: Type of Waste Identified in ALPHA
| | Type of waste | Wasability % | Causes | Remedies |
| | MATERIAL WASTE | 25% | | a) Scrap in the form of rejected jobes | 5% | * Absence of source inspection on some part (For e.g. presence of hard spots in castings) | * Carry out source inspection | | * No reconditionign done for obsolete Gear cutting machines | Replace or recondition both gear cutting machines as early as possible | | * Faulty machines | Operator training | | * Unavailability of calibrated gauges on lathe | Maintain record of calibration schedule of the gauges and make sure that the gauges are available on the he machines with the worker for critical dimensions | | b) Chips | 10% | * Faulty tool setting | Ensure proper tool setting | | | * Design problem | Modify the design | | c) Coolant wastage on lathes during groove cutting | 3% | * Excessive high flow rate of coolant causes wastage by spurting | Control the coolant flow rate | | d) Paint wastage during the painting of Baby hoist | 7% | * Oversize Nozzle Diameter | Choose proper nozzle diameter of paint sprinkler | | * Unavailability of paint Booth | * Use paint booth | | ENERGY WASTE | 15% | | a) Power wastage in the Coolant Pumps of turning lathes | 8% | * Coolant Pump is even when the jobs are not being machined or the machine is stopped | Coolant pump switch must be provided near the ON/OFF control panel of the machine | | b) Light in the conference room through the day wastage | 5% | * Negligence by employees | Ensure that the lights are switched OFF immediately when the person leave the conference room | | c) Excessive number of fans used on the shop floor leading to electricity wastage | 2% | * No natural circulation of air due to absence of cross-ventilation leading to necessity of fans | Provide Cross Ventilation to facilitate natural circulation there by reducing the need for fans. | | HUMAN WASTE | 20% | | a) Idle operators on the vertical Machining Centre | 2% | * Excess Manpower (currenlty 4 operators are assigned while 2 are suficient at current load level) | * Reduce the number of operators assigned to VMC to Two. | | b) Operators in the Assembly Shop idle | 4% | * Shortage of required components/materials from the machine shop | * Proper planing | | * Coordination with material handling system | | c) Excess of Handwork and deburring | 8% | * Improper tool design and machine setting | * Modify tool and component design | | * Absence of GearChamfer in design andno Gear shavingoperation after gear hobbling | * Introduce Gear finishing operation like geat shiving. | | d) Human Skill wastage in packaging operations | 1% | * Skilled operators involved in packaging | * Use casual of contract labors for packaging. | | e) Employees in the account and Purchasing Department remainidle | 5% | * Overstaffing leading tounder-utilisation | * Proper allocation of work and assigning ofpending tanks. | | INFORMATION WASTE | 15%(OF DOCU) | | a) Duplication of paper work (Example daily production report) | 10% | * Quality and Production Department generate their separate production reports | * Proper co-ordination between quality and production departments | | * Use of communalised format | | b) Unwanted report taken out by Production and Planning | 5% | * Improper report frequency (Example Shift-wise production | * Only consolidated daily production report is required by the top management | | MACHINE WASTE | 40% (Units) | | a) Under utilisation of VMC | 5% | * Special Jigs, Tools and Fixtures for machining production reports not available in the VMC | * Expedite the design of Jigs and Fixtures | | b) High Downtime on Gear Hobbing & Geat Shaping Machines | 5% | * Reconditioning of the machine is not done | * Replacment of these machine and preventive maintenance on others required | | * No preventive maintenance | | c) Machines remaining idle due toworker absenteeism | 2.5% | * Heavy absenteeism | * Control and proper allocation | | * Multiskilled workers not available | | d) Varying batch sizes scheduled on different machines the product flow leading to idle time | 10% | * diffetent products machined on different machines at the same time | * Use of dedicated machines for a particular product (Cellular Layout) | | TIME WASTE | NQ | | a) Excessive time for handwork and other perparations | NQ | * Faulty layout | * Layout modification suggested | | b) Time wastege due to unavailability of proper tools on machines | 10% | * Proper tools on mahines not available | * Make proper arrangement to ensure availability of tools | | c) Frequent regrinding required for HSS tools used on Lathes due to faster wear | NQ | * HHS tools which are used for turning operation wear out fast | * Use throwaway type tipped tools of Carbide tools to have a longer tool life | | SPACE WASTE | 10% (units) | | a) Potential space for automated Material Handling used for material/WIP storage. | 3% | * Higher WIP and improper layout | * Allotment of separate bays for material storage neer work stations. | | b) Large area behind the plant remaining unutilised | 7% | * Improper space utilisation | * Modification of site plan and facilities relocation | | MISC. WASTE | NQ | | a) High cost of Warranty failures | DNA | * Repeated limit switch linkage failures on Baby Electric Hoist | * Try to eliminate recurring problems by design and process modifications | | * Recurrence of some frequenlty occurring complaints due to lack of corrective actions | | b) Excess Inventory Raw materials | DNA | * Excess material procured (example imported seamless pipes from Japan are procured for complete year) | * Proper Inventory Control methods | | Work in Process | | * Absence of Single Piece Flow and dedicated machines | | | Finished Goods | | * Overproduction in anticipation of demand | |
| | NQ = Non-quantifiable; DNA = Data Not Available |
| | | Table 3: Types of Waste Inentification for BETA
| | Category | Nature of Waste | Causee | Remedies |
| | MATERIAL | Extra removal of material while machining the roll of regain the required pass profile. | Negligence of the operator. | Tight supervision and availability of proper template must be ensured. | | Non availability of required template. | | Wastage of tool life due to reduction in shank size. | Poor design | Improve the design, Weld extra material to shank. | | Scrapping the roll when it reached its scrap size, though its quality and strength still sufficient to use for further rolling. | Reppective mill constraint | | Skilled operator is not available. | Proper planning & training to the concerned person is the required remedy. | | Wastage of computer stationery | Poor planning. | | MACHINE | Not meeting the required Specifications | Aging of machine | Induction of new machines like CNC lathe etc. | | Excessive downtime. | Non availability of spare parts | | MANPOWER | Surplus direct/indirect work force. | Faulty agreement with trade unions. | Re-negotiate the agreement | | Management personnel time is wasted in some irrelevant activites. | No clear cut Exit policy by the government | Re-deployment of excessive work force. | | Managerial failure. | | OPERATIONS | Unnecesary larger set up time for lathes | Non-standard operating paractices | Follow the standard operating practices. | | Non availability of crane operator resulted into unnecessary. loss of production target. | Non-availability of workers on time for setting up the machine. | Director labor must be involved in set up activities. | | Production time wasted om curative maintenance activities. | Maintenance personel belong to other departments. | Proper coordination with such deparments is required. | | INDIRECT | Larger time required for setting up of rolling mills. | All such waste occur when rolls with defective finishing are sent mills. | Proper inspection of rolls can reduce such wastes to a great extent. | | Lot of defective production | | Increased rolls breakage | | Loss of roll life. | | INVENTORY | Excessive inventory of unused roll occupying lot of space | Change in product mix. | Recycling of rolls, possible. | | Inventory of rolls in circulation is of the order of approximately 40–50 Million of rupees | Erratic rolls consumption pattern of roling mills. | By following standard oprating practices during rolling. | | Inventory of machine tools | No specific inventory policy of management | Managment must follow inventory policy strictly. | | Inventory of other accessories e.g. safety shoes, gloves, etc. |
| | | Table 4: Type of Waste Identified for GAMMA
| | Waste | Causes | Solution | Projected Savings/Benefits Enviseged |
| | A) MATERIAL | | 1) Damage of needle bearings used ingear boxes (about 2%) | Weaker cardboard packing. | Stiffer cardboard packing. | Elimination of bearing rejection due to damages. | | Three days inventories level leading to stack-ing of cartons and damage of bottem ones. Storage place at almost floor level resulting in to rough handling. | Inventory level reduced to 1–1/2 shift requirement eliminating stacking | Saving : Rs 0.5 Million/year. | | 2) Roller bearings used in gearbox | Damage during gearbox dismantling resulting intorejection (about 0.5%) | Design & mfg. of bearing pullers for different sizes of bearings. | Elimination of bearing rejection due to damages. | | Savings : Rs 0.5 Milllion peryear | | 3) Gearbox lubrication oil wastage | No instrumentation for accurate measurement of quanitity of oil being filled in gearbox due to which oil was filled up to filler plug level. | Electronic measure-ment instrument needed. | Reduction of spillage to 1% | | Oil pump control mear away from the operator leading to overfiling and wastage (wastage 5%) | Oil filing to be stopped after reaching design specified limit. Control to be shifted mear filler pipe | Savings : Rs 1 Million/year | | B) ENERGY | | 1. Compressed air | Air leakage from joints (FRL and nutrunner joints). | A centralised FRL unit for the entire conveyor reducing the no. of joints. | Not quantifiable. | | 2) Electrical | Gearbox test rig dynamometer cooling fan remain ‘on’ till the main switch (away from test rig) is ‘on’ | Decentralised controlswitch. | Not quantifiable. | | Function of fin is to (away keep dynamometer temperature under control. To be done by a thermocouple controlled switch. | | 3) Heat/electrical | Furnace for heating gears before pressing has thermo couple at the top and heating coil at the bottom with only natural convection leading to non-uniform overheating and thus poor quality. | A forced circulation fan to maintain temperature uniformity | Electrical energy saving; not quantifiable. | | Rejection eliminated from1% to zero. | | Savings : Rs 50,000/year. | | C) INFORMATION | | 1) Gearbox inventory reports | Reports highlight the defects and not theircauses. | Reports to be modified to highlight causes where by immediate actions canbe taken for correction and future prevention | Not quantifiable | | Management cannot contribute due to this. | | 2) Componentinventory reports | Compound reportssill not used on shopfloor due todiscrepancy inventory | Stage-wise rework/rejection to be booked at every shift end to eliminate discrepancy. | Not quantifiable | | D) MACHINES | | 1) Hobbing machine | Under utilisation due to non availability of tooling for ring loader (33% utln) | Design and mfg. of tooling common to all ring leader to increase flexibility and Utilisation | Inctease in machine. | | Utilisation by 35% to 70% | | 2) Grinding maching | High set up time forbore grinding(4hrs) | Hydraulic jaw chuck with greater strok to allow clamping of more than one gear with PCD in the range of 10 mm. | Reduction in set-up time to 30 min from 4 hours | | E) TIME | | 1) Time required to fine out chassis with gear box defects | Rolled out chassis parked in a haphazard way leading to a large amount of time spent for finding them | Formation of a proper layout with eaarmaked spaces for chassis with diffrent aggregate defects | 16 man-hours/day. | | 2 men/day instead of 4 men/day are used. | | 2) Oil leakage from gearbox | Aluminum cap on gearbox having pin holes through which leakage is detected only after fitting it on the chassise. This leads to 16 man-hours spenton removal and fittingit on the chassis. | Introduction of air leakage testing of gearbox, which will detect smallest pin holes (air viscosity far less that of oil) before hand. | 32 man-hours/day | | Daily two gearboxes were changed on vehicle which was eliminated | | F) SPACE | | 1) Space for storage of finished gearboxes | Single level storage of gearboxes on pallets | Pallet modification to facilitate multilevel storage of the pallets | Increase in space utilisationby 200%. | | Earlier 20 pallets were stored. Now 60 pallets can be stored. | | 2) Space for WIP between bore frinding and lopping machine. | Gears are stored on atrolley (capacity 200 gears) after bore grinding for lapping. Transger batch is onetrolley full. | The lapping machine to be shifted by the side of bore grinding machine working to be started taking advantage of highcycle time on bore grinding. | Saving 60 sq. feet | | Due to multi machine working one man/day issaved. | | G) MANPOWER | | 1) Excess overtime in B&C shift | Assembly works onpull system with lots of shortage in A shift. This shortage is madeup in B&C shift. | Gradual reduction in C shift output and priming the A shift thereby reducing O/T requirements | 200 man-hours/day. | | 2) Conveyor breakdown (14 menon conveyor) | The trolley of conveyor goes downalong with a gearbox leading to an accident and breakdown ofconveyor. | Proximity switch atthe end of the conveyor to indicateand stop the conveyor if a gearbox is notremoved from trolley | 10 man-hours/day. |
| |
|
References | | 1. | HartS.L.1997;
Strategies for Sustaining World,
Harvard Business Review, Vol
55, No
1, pp
67–76.
TopBack | | 2. | HitomiK1997;
Manufacturing Strategy for Future Production Moving Towards Manufacturing Excellence,
Int. J of Technology Management, Vol
14, No.
6/7/8, pp
701–711.
TopBack | | 3. | CooleyM1987;
Architect or Bee?,
London,
Hogarth Press.
TopBack | | 4. | CollisD.J., MontgomeryC.A.1995;
Competing on Resources: Strategy in the 1990’s,
Harvard Business Review, Vol
53, No
4, pp
118–128.
TopBack | | 5. | MiyaiJ1997;
Green Productivity, Green Productivity in Pursuit of Better Quality of Life.
Asian Productivity Organisation,
Tokyo, pp
151–155.
TopBack | | 6. | MohantyR.P.1988;
Factors Affecting Productivity: The Perceptions of Indian Managers.
Industrial Management and Data Systems,
July–August, pp
21–26.
TopBack | | 7. | SmithM.1997;
A Brief History of Waste Minimisation,
Environmental Protection Bulletin, pp
8.
TopBack | | 8. | MohantyR.P., RastogiS.C.1988;
Assessment of relationship between productivity and profitability: and Indian example.
Malaysian Journal of Productivity, Vol
4, No.
6, pp
46–61.
TopBack | | 9. | MohantyR.P., LakheR.R.1994Understanding TQM,
Production Planning and Control, Vol
5, No
5, pp
426–441.
TopBack | | 10. | MohantyR.P.1998;
Understanding the Integrated Linkages between Quality & Productivity,
Journal of TQM, Vol
9, No.
8.
TopBack | | 11. | MatherH.F.1991,
Concentrate On Attacking Non - Value Added Waste,
Industrial Engineering Journal, Vol.
35, No.
3, pp
21–25.
TopBack | | 12. | CraigC.E., HarrisR.C.1973,
Total Productivity Measurements at the Firm Level.
Sloan Management Review Vol
14, No
3, pp
13–20.
TopBack | | 13. | MohantyR.P., RastogiS.C.1994;
An Industrial Application for Total Productivity Optimisation,
Production Planning and Control, Vol
4, No.
2, pp
219–228.
TopBack | | 14. | EilonGold B., SoesanJ.1976;
Applied Productivity Analysis for Industry,
Pergammon Press,
Oxford.
TopBack | | 15. | NaderiA.1997Productive Design: A New Designing Attitude, Green Productivity in pursuit of better quality of life,
Asian Productivity Organisation,
Tokyo, pp
178–182.
TopBack | | 16. | United Nations Environment Programme1994;
Government Strategies and Policies for Cleaner Production,
Paris,
UNEP Industry and Environment.
TopBack | | 17. | JesdaPipat S.Induced Sustainable Development Policy and International Cooperation: The Case for Greener Technologies.
Green Productivity in Pursuit of Better Quality of Life,
Asian Productivity Organisation,
Tokyo, pp
229–240.
TopBack | | 18. | DumbleP.1998;
Waste Minimisation as a Building Block for the Introduction of Environmental Systems to Large and Small Companies,
IWM Proceedings,
March pp
29–31.
TopBack | | 19. | PhillipsP.1998;
A Team Approach to Tackling Waste Minimisation,
Waste ManagementFebruary, pp
14–16.
TopBack | | 20. | BerkelR.1997;
Cleaner Production in Asia: Examples of Results and their Methodological and Strategic Implications,
Green Productivity in pursuit of better quality of life,
Asian Productivity Organisation,
Tokyo, pp
195–214.
TopBack | | 21. | ChecklandP.B.1989,
Soft Systems Methodology,
Human Systems Management, Vol
8, pp
273–289.
TopBack |
Appendix I Clean Manufacturing Self-Assessment Which stage best describes your company’s current situation?
None of the stages Stage I Stage II Stage III Stage IV
As an unit head of your company, how satisfied are you with your company’s current situation in this category?
Very dissatisfied Not satisfied Some what satisfied Very much satisfied
How much benefit would your company receive by moving to the higher stage in the progression?
None Some Quite a bit A great deal
How much effort would be needed to move to the next higher stage in the progression?
None Some Quite a bit A great deal
|
Appendix II Definition of Stages Stage I: | = | No policy about green productivity. No strategies for clean manufacturing (or we have a policy which is not well communicated or well accepted). |
Stage II: | = | We have policy and strategies, but no awareness and commitment. We address such strategies on an ad-hoc basis. However, we have made some impact in making a foundation for waste management. |
Stage III: | = | We have specific policy and comprehensive strategies. The implementation emphasis varies from unit to unit. Some units have started the foundation work. However, we have made effective interactions with various people in this context. |
Stage IV: | = | We have a clear, comprehensive, well-documented and well communicated policy and strategies. We have a high level of awareness and commitment throughout the company. Our manufacturing strategic planning processes fully consider all wastes. Our investment decisions reflect the total minimisation of waste approach. We have identified responsibility centers and targets for wastivity. We recognize and reward our project teams for successful teams. We are viewed as the leader in green productivity movement. |
|
|