On December 9, 1988, printed on page C7 of the Antelope Valley Press, was a list of major earthquakes. Here is what this author found after breaking down the list into roughly 20-year intervals and doing some research on both earthquakes and strange weather phenomena which seem to go hand in hand: |
From 1906 to 1927 (21 years) 6 major quakes were recorded, 2 in China, 2 in Italy, 1 in the USA and 1 in Japan. The death toll for all these quakes: 500,000. |
1932 to 1953 (about 20 years) 6 different nations were hit by 11 major earthquakes which killed 180,000. What caught my attention in this series were the 1939 and 1953 tremors in Turkey. |
1956 to 1976 (20 years) 13 different nations were shaken by 20 quakes which (unofficially) took 2 million lives or (officially) one and a half million. |
Missing from this list was the great Alaskan quake of 1964. |
What appears to be a pattern shows very distinctly in this time span—it is obvious that there is a dramatic increase in the number of these deadly quakes around the world and in Middle Eastern countries. |
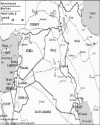
What appears to be a pattern comes through very distinctly in this time span—it is obvious that there is a dramatic increase in the number of these deadly quakes around the world especially in Middle Eastern countries. Turkey (with 4 quakes) and Iran (with 5) are being shaken every 2 years by these very destructive forces beginning 1957. It should be noted that Iran and Turkey are neighbouring countries and have an earthquake fault line running through them (see chart 1). Iran is also one of the largest oil producing nations in the world. This should be remembered as we try to figure out what is happening to the planet.
|
1977 to 1985 (8 years) 9 countries were shaken by 8 earthquakes and about 50,000 killed. Not included in the list is the Armenian quake of December 1988 which killed over 20,000 and the 7.3 intensity qake in India in August 1988. It should be noted that Armenia is also a neighbour of both Turkey and Iran (see Chart 2).
|
It is obvious from all this that a trend started, at the turn of the century, where the earthquake numbers were doubling every 20 years. After 1985, however, the number skyrockets. In 1990 alone 68 major earthquakes (over 6.5 on the Richter scale) were recorded and, between 1977 to 1991, a total of 136 major earthquakes shook the world. This represents a significant increase in the number of quakes over the previous 70 years. |
The Middle East, from 1953 and on, has been suffering great loss of life and property from these powerful earth quakes. This is something unparalleled in that region in all its recorded history. |
Top Our delicate planet Planet Earth in some ways is a very delicate planet. The crust on which we live and which also contains the oceans is very thin in comparison to the core. In comparison to the skin of an apple, the earth's crust is much thinner and it has fault lines that, in some places, completely encircle the globe and this tends to reduce the amount of stress it can take before it slips and creates an earthquake. The stresses on the earth's crust are tremendous—especially from the centrifugal force created by the 1000 mile per hour spin speed (at the equator where this speed causes the earth to bulge 40 miles) and the 66,000 mile an hour orbital speed around the sun. The moon and the sun's gravity are also acting on the seas and causing great changes in their levels (tides) which affects the pressure they exert on the delicate crust. The spin and orbital speeds combine to create another effect (which few people fully understand) called ‘Coriolis Force’. This force combined with the centrifugal forces could (if we continue to abuse our planet) shake the earth to pieces. |
Top The curse of pumping too much oil Man, over the years, has not considered the danger of throwing the earth out of balance by pumping billions of gallons of oil out of the ground and mining billions of tons of coal and converting these liquids and solids into gasses which are then made a part of our atmosphere. Adding so much heat and gas to the air around us has to affect the barometric pressure and this in turn (according to T. Marshall Eubanks, a researcher in the British journal Nature) is causing the earth to wobble like an out of balance washing machine. It already has a two-foot wobble at the poles and if it continues to get worse it could cause the ocean tides to become very dangerous or, even worse, create a worldwide earthquake! |
According to the records I have seen published: |
In the 100-year period (1868–1968) 200 billion barrels of oil were produced around the world. But what was most shocking was the use of 400 billion barrels of oil the following 20 years (1968–1988) and the fact that a major part of this oil came from Iran and neighbouring countries. |
In the 100-year period (1868–1968) 200 billion barrels of oil were produced around the world. But what was most shocking was the use of 400 billion barrels of oil in the following 20 years (1968–1988) and the fact that a major part of this oil came from Iran and neighbouring countries. When you consider that each of these barrels contains 42 gallons and weighs about 306 pounds you begin to get some idea of the tremendous amount of weight this totals up to. Simply multiply 600 billion by 306. If you want to know the heat factor multiply each barrel by 5.8 million BTUs. 8,000,000,000 barrels equals 1 quadrillion BTUs (1 Quad) which is enough to run 10 million cars for one year. Also, for each gallon burned, 23 pounds of carbon dioxide are produced! |
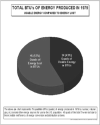
The chart (#3) constructed using information published by the Energy Information Administration shows how we went from wood burning to nuclear power and how many Quads (Quadrillion BTUs) of energy have been used between 1900 and the year 2000 and also how these factors create earthquakes. Another chart (#4) brings to the fore another sad fact. In 1979, 45 Quads of energy out of the 79 Quads used in the USA were lost because of poor efficiency in gasoline engines and steam turbines used to produce electrical energy. Some of this energy was also lost in the power transmission lines. This means that over 50 per cent of our energy went out of the window—enough to run 450 million cars for one year!
|
In essence one can also use a Quad as a measure of the amount of gas that has been released into the atmosphere and this does not present a pretty picture from the point of view of weather effects. |
Top Scientific concerns over weather As far back as May 1966 scientists were expressing concern over weather conditions around the globe. Some were blaming the (above ground) explosions of H-bombs by both the USA and Russia for causing the problem. An article in the May 1966 issue of Science And Mechanics by A.I. Schutzer accused the Russians of deliberately setting off 10 ‘dirty’ H-bombs in 1961 and 270 megatons of H-bombs in 1962 near the Arctic Circle in order to improve their climate while making the US weather worse. |
Some of the instances of bad weather given as a result of the bomb blasts were: |
In 1965, 4 inches of snow fell on England in August. The river Tiber in Rome was filled with ice chunks for the first time in 500 years. The US weather was also bad—there was a drought in the North East while the western deserts had torrential rains. The tornado rate had increased from an average of 150 a year to 300 a year (the 1988 count was about 900). Meanwhile the author (Schutzer) claimed the Russian weather had greatly improved. They were having milder winters while their deserts were blooming because of heavy rains. His conclusion was that US weather-related problems should be blamed on the Russians. Most scientists of that time disagreed with him. |
Another magazine, Saga, in their May 1966 issue, carried a story by Peter Lamb who also blamed the bomb for the weather problems but he put the blame on both the American and Russian scientists. He cited the record concerning floods, tidal waves and avalanches around the world. |
In the 51 years between 1896 and 1947 only 6 such events were recorded in the books, but from 1947 to 1965 (18 years) there are 12 recorded incidents of that kind. |
The hurricane record for 1900 to 1944 shows only 11 storms while, from 1944 to 1965 (21 years), 13 hurricanes are recorded in half the previous time— an obvious increase. Lamb concludes that the bad weather and some earthquakes are caused by the H-bomb explosions and he is amazed that no official investigation is being conducted to find out the truth of the matter. |
If what these men concluded, back in 1965, was true then the number of earthquakes, tornadoes and hurricanes should have decreased after the above ground H-bomb testing was stopped several years ago but, on the contrary, these weather and earthquake problems have continued to grow and the human race is paying a terrible price in terms of life and property. |
Since the main cause of the weather problem appears not to be the Bomb, then the only other cause has to be the burning of these gigantic amounts of oil and other forms of fuel. |
Since the main cause of the weather problem appears not to be the Bomb, then the only other cause has to be the burning of these gigantic amounts of oil and other forms of fuel. While disrupting the weather, we are throwing the earth out of balance by pumping so much oil out of areas near the rapidly rotating surface at the equator and the burning of the oil along with coal, natural gas and wood products is affecting the atmosphere by increasing (unevenly) the volume of gas which it comprises. We know that high pressure ridges (high mountains of air) create dry weather while low pressure ridges create wet weather. In order to show the dramatic change in barometer readings over the years, in 1987 when hurricane ‘Hugo’ came ashore on the east coast, the lowest barometer reading ever seen was recorded. At the same time, in Alaska, the highest ever barometric reading was recorded. This caused problems for the air traffic control towers as the barometric pressure was beyond the maximum on their dial, rendering them unable to give pilots accurate barometer readings necessary to reset their altimeters. It is clear that no one expected to see such high readings, least of all the barometer manufacturers. |
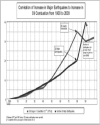
The charts 2 and 3 can be used to show the correlation between the increase in oil production and the rise in bad weather and earthquakes. Chart 4 very clearly shows how the multiplication of earthquakes (especially in Iran and Turkey) has coincided with the increase in oil production. It should also be noted that, from 1953 to 1985, Turkey and Iran have suffered a total of 11 major quakes. The previous 50-year history shows nothing like it. I believe drilling oil wells near fault lines is an invitation to disaster as is apparent in the case of Iran. |
Another problem one has not considered, which could be even more dangerous, is the melting of the polar ice caps. |
Scientists, who believe in man-made global warming, feel that one of the most damaging results of this ice pack melting will be the flooding of coastal regions as well as the submerging of low-lying islands. These scientists have failed to consider that earthquakes could also be triggered by the melt off—but how can the melting of this Antarctic ice cap cause earthquakes? |
In order to understand why this could already be happening, one must examine the composition of Antarctica. According to certain published figures, Antarctica a few decades ago had seven and a half million cubic miles of ice. The weight of this ice has caused the land mass to sink 2000 feet. The displacement of this enormous land mass (5 ½ million square miles) has forced other parts of the earth to rise up because of the ‘hydraulic’ effects brought about by the pressure on the molten core of the planet. |
It has taken millions of years for the ice pack to grow and gradually increase these earth-moving pressures on the rest of the planet but, now, the ice pack is melting at what some consider to be an alarming rate which is causing an average of 212 square miles of ice to slip into the West Antarctic sea each year. In 1987 about 4,500 square miles of ice broke off (in two pieces sized at 1,500 and 3,000 square miles) and in 1998 another 3,000 square miles broke off in one big piece and floated away. This weight change has to affect the pressure on the tectonic plates and this probably is one of the causes of some of our earthquake problems. |
Seismologists say that a sudden earth displacement of 10–20 feet can trigger a catastrophic earthquake. |
Seismologists say that a sudden earth displacement of 10–20 feet can trigger a catastrophic earthquake. What would happen if the sunken earth of the Antarctic region were to spring back (even a few hundred feet) after enough ice melts away? Could this trigger a worldwide earthquake? I believe it could and this will happen sooner than people expect. |
Top The solution to this deadly problem We can close our eyes and hope the problem will go away, or we can try to do something about it before the ultimate catastrophy occurs. This problem is here and now and it threatens to devastate the planet. Worldwide earthquakes can trigger volcanoes by cracking the earth's crust. Underwater volcanoes could poison the ocean waters and kill the fish. The land volcanoes can poison the air we breathe and block out the sun creating a global nuclear winter, or if the eruptions are severe enough, they may do just the opposite and increase the temperature to unbearable levels. Fear alone will cause the extinction of much of human and animal life. |
Top Figures Chart 1:
|  | |
| Chart 2:
|  | |
| Chart 3:
|  | |
| Chart 4:
|  | |
|
|